
Figures & data
Figure 1. River networks with and without mesh structures (a) Natural river network without a mesh structure (b) Urban river network with a mesh structure.
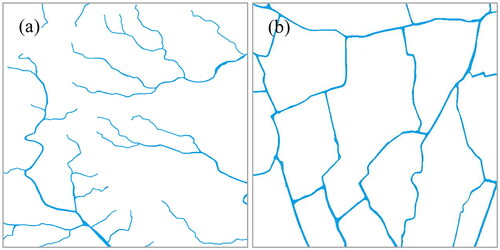
Figure 2. The selection of raster river networks.
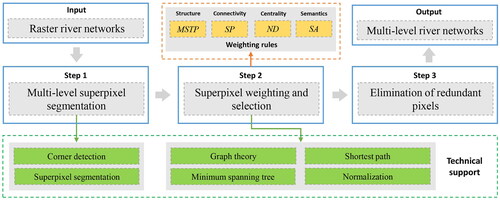
Figure 3. Multilevel superpixel segmentation of a raster river network (a) Original raster river network in PNG format (b) Results of preliminary linear spectral clustering (LSC) superpixel segmentation at a size of 2000 pixels (c) Corner detection of superpixels (d) Results of multilevel LSC superpixel segmentation at a size of 10000 pixels.
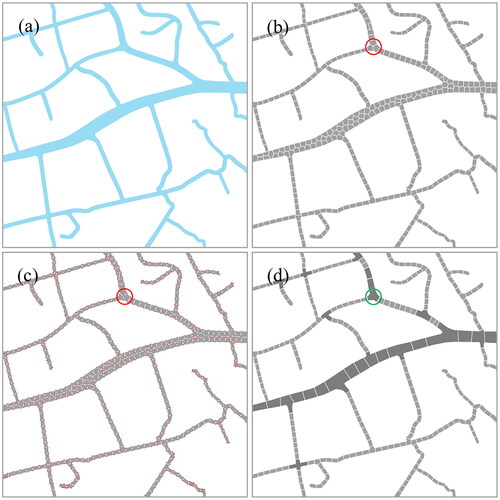
Figure 4. Weighting rules for minimum spanning tree pruning (MSTP) (a) Minimum spanning tree (MST) of the river network superpixels (b) Visualization of nodes and edges of the MST structure (c) Results of MSTP weighting for the river network.
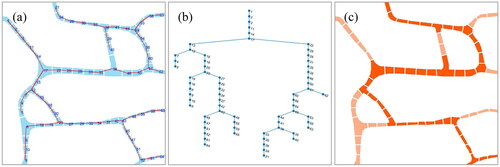
Figure 5. Sample river network superpixel weighting and selection (a–e) The minimum spanning tree pruning (MSTP), shortest path (SP), node degree (ND), and superpixel area (SA), and total weight results, where the darker the color, the higher the weight (f) Results of river network selection based on weight ranking.
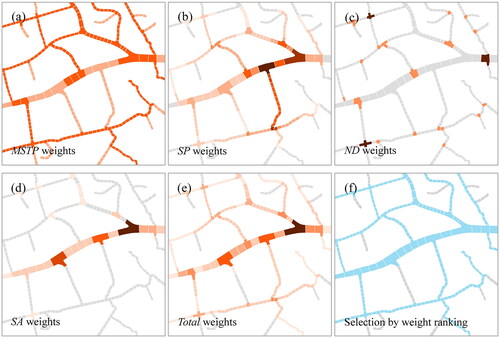
Figure 6. Elimination of redundant pixels at river network intersections.
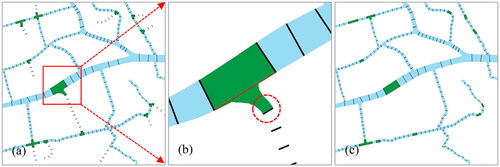
Figure 7. The original raster river network in Guangzhou Province, China.
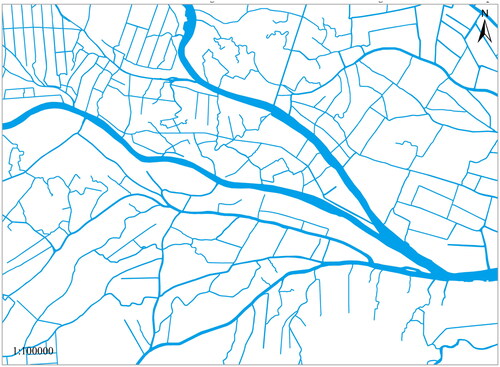
Figure 8. Results of multilevel superpixel segmentation for the raster river network.
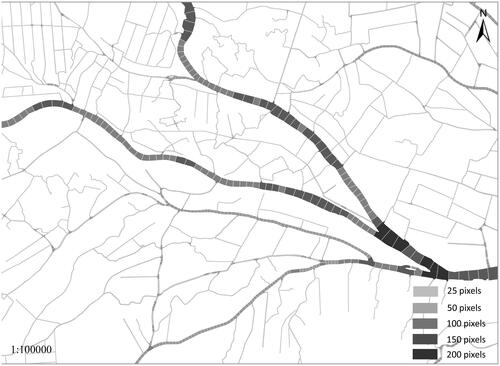
Figure 9. MSTP, SP, ND, and SA weights for the river network superpixels at two different levels.
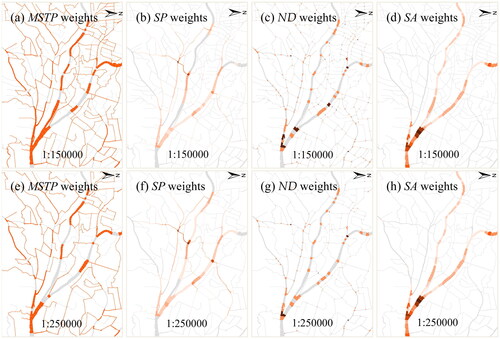
Figure 10. Examples of superpixel selection results using reasonable and inappropriate weight coefficients (a-d) Normal weight coefficients and
(e-h) Small weight coefficients
and
(i-l) Normal weight coefficients
and
(m-n) Smaller weight coefficient
and larger weight coefficient.
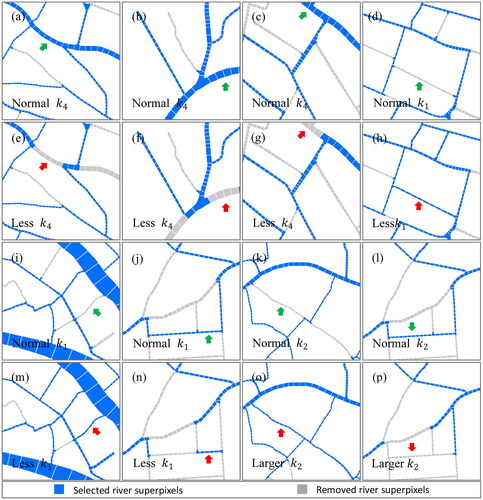
Figure 11. Results of river network selection with the proposed superpixel river network selection (SRNS) method and the stroke-based method. (a) The original raster river network (b-c) Selected results using the SRNS method at two different scales (d) The original vector river network (e-f) Selected results using the stroke-based method at two different scales.
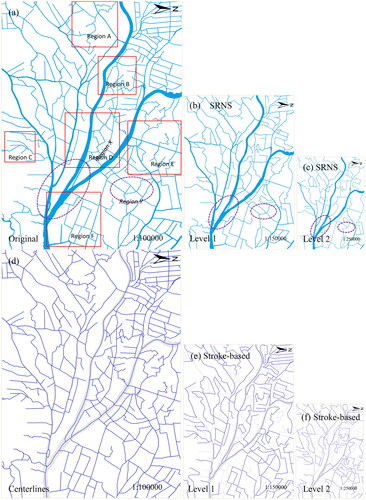
Figure 12. Detailed comparison of the selection results in regions a–f, as obtained using the stroke-based and proposed SRNS methods.
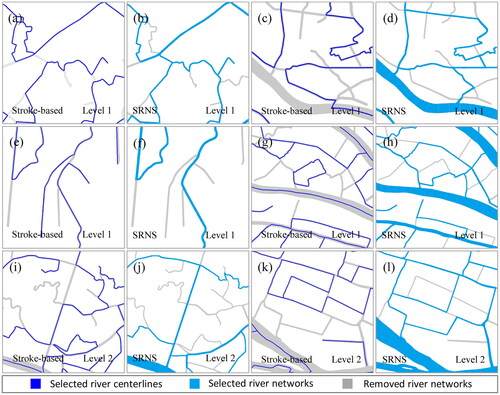
Table 1. Quantitative evaluation of the selection results obtained using the stroke-based and proposed superpixel river network selection (SRNS) methods.
Figure 13. Density contrast in the river network selection results obtained using the proposed superpixel river network selection and the stroke-based methods.
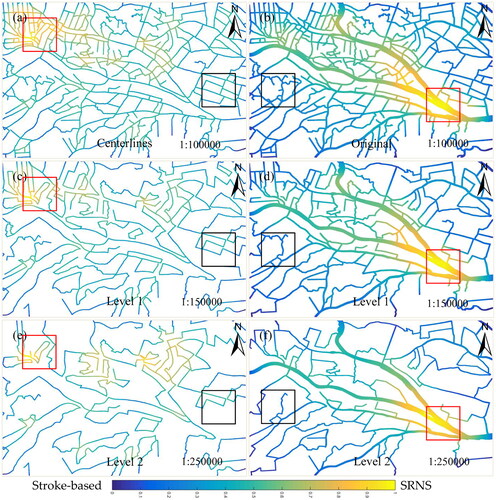
Table 2. Comparison of quantitative density changes based on the stroke-based and superpixel river network selection methods.
Figure 14. Comparison between the proposed superpixel river network selection (SRNS) method and the typical Delaunay-based and coding-based methods. (a) The original natural river network (b-c) Selection results at two levels using the Delaunay-based method (d-e) Selection results at two levels using the coding-based method (f-g) Selection results at two levels using the proposed SRNS method.
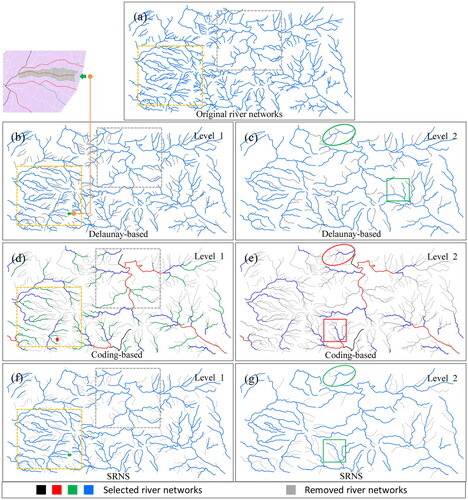
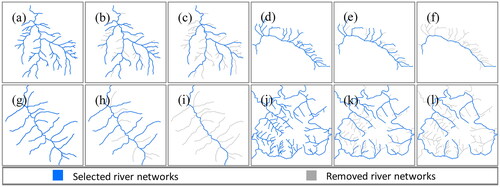
Figure 15. Application of the proposed superpixel river network selection method to river networks with different patterns. (a-c) The original dendritic rivers and the selected results at two levels (d-f) The original comb-like rivers and the selected results at two levels (g-i) The original skeleton-like rivers and the selected results at two levels (j-l) The original radial rivers and the selected results at two levels.
Data and codes availability statement
The original river data and codes can be downloaded from https://github.com/Cartography0706/rivers