
Figures & data
Figure 1. Topology of counties in North Carolina.
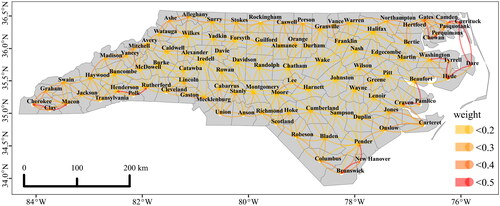
Figure 2. (a) The empirical relationship between strength of spatial auto-correlation () and percentage bias of q-statistic in GDM from three spatial econometrics models (true data generating processes). To avoid overlapping error bars, the curve of SEM is shifted 0.01 units to the left and the curve of SDM is shifted 0.01 units to the right; (b) The empirical relationship between Moran’s I and percentage bias of q-statistic in GDM under three spatial econometrics models. The same value of
corresponds to different Moran’s I under three models. As a result, the starting and ending points of the three curves exhibit tiny differences.
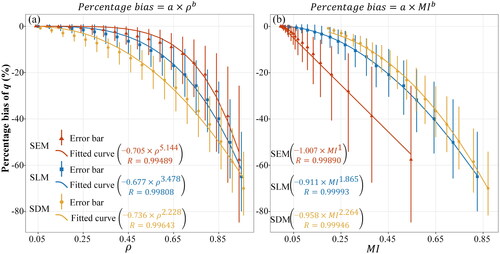
Figure 3. Variables examined in the study: (a) Desertification index; (b) Nighttime lights intensity; (c) Population density; (d) Total precipitation; and (e) Soil moisture.
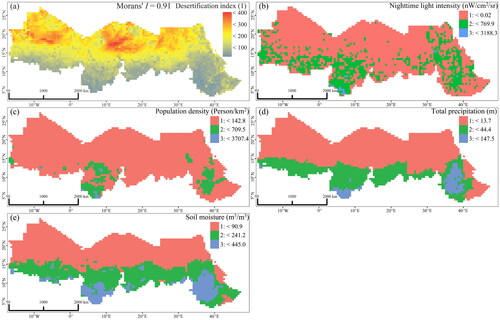
Table 1. Statistical summaries of variables used in this study’s models.
Table 2. Estimation results on the LM-test.
Table 3. Estimation results on the Akaike information criterion and variable importance.
Table 4. Decomposition results for variable importance.
Data and codes availability statement
Data used in the empirical study and the R code for implementing the Monte Carlo simulation experiment are available for download at Figshare, https://doi.org/10.6084/m9.figshare.24196608.