
Figures & data
Table 1. Distribution of companies’ activities, by ICB classification.
Table 2. R&D activity types.
Figure 1. The ICT global innovation network in 2011.
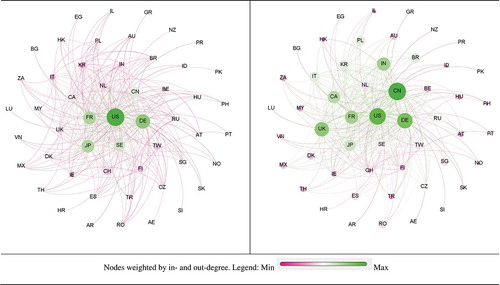
Figure 2. The ICT global innovation network in 2015.
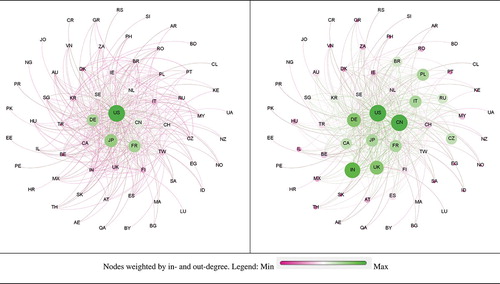
Table 3. Distribution of companies and ICT R&D centres by country of ownership, location and out- and inward internationalisation in 2011 and 2015.
Table 4. ICT GIN indices.
Table 5. Countries’ position in the ICT GIN, 2011 and 2015.
Table 6. Core/periphery model statistics in the 2011 and the 2015 ICT GIN.
Table 7. Block membership by country in 2011 and 2015 ICT GIN.
Table 8. Estimation results of the determinants of the linkages in the GIN.
Table 9. Estimation results of the determinants of the change of intensity of R&D linkages in the ICT GIN.
Table A1. Descriptive statistics.
Table A2. Pair-wise correlations between variables.