Figures & data
Table 1. Descriptive statistics of the pair between MNC R&D sites and external organizations with at least one collaboration.
Graph 1. Mean number of collaborations for different geographical distance intervals between MNC R&D sites and external organizations with confidence intervals. Geodist intervals (0–100 km, 100–500 km, 500–1 000 km, 1 000–2 000 km, 2 000–5 000 km, 5 000–8 000 km, 8 000–10 000 km, >10 000 km).
Table 2. Descriptive statistics of all possible pairs between R&D sites and external organizations.
Table 3. Correlation matrix. *p < 0.05.
Table 4. Zero-inflated negative binomial regression model testing the number of collaborations of pharmaceutical MNCs for the period 2000–2012. Dependent variable: number of collaborations.
Table 5. Zero-inflated negative binomial regression model testing the number of collaborations of pharmaceutical MNCs for the period 2000–2012. Dependent variable: number of collaborations.
Table A1. Classification of the articles into therapeutic areas through the heading MeSH term.
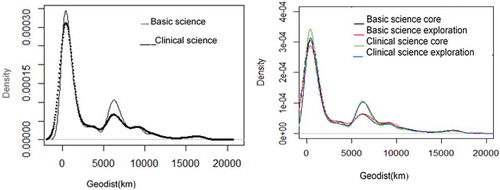
Figure A1. Density of the distribution of collaborations according to the distance (km) between an external organization and an MNC R&D site. Kernel density graphs.