Figures & data
Figure 1. The research design: a mixed-methods approach to address RQ1and RQ2.
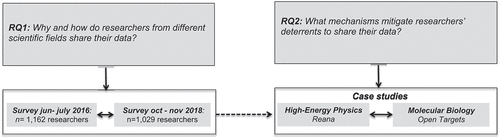
Table 1. Enablers and deterrents for data sharing in science according to prior literature and implications from collective action and epistemic cultures perspectives
Table 2. Factors related to data sharing
Table 3. Researcher willingness to share data for various reasons and experience of it
Figure 2. Data sharing by discipline.
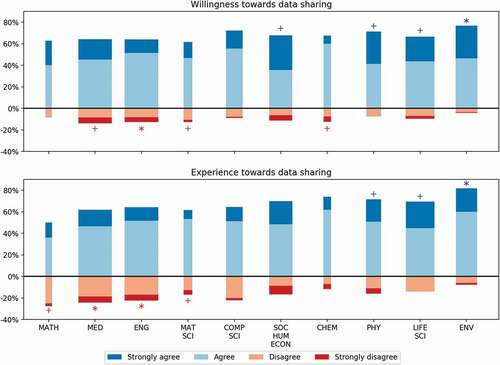
Figure 3. Data sharing outcomes across all fields.
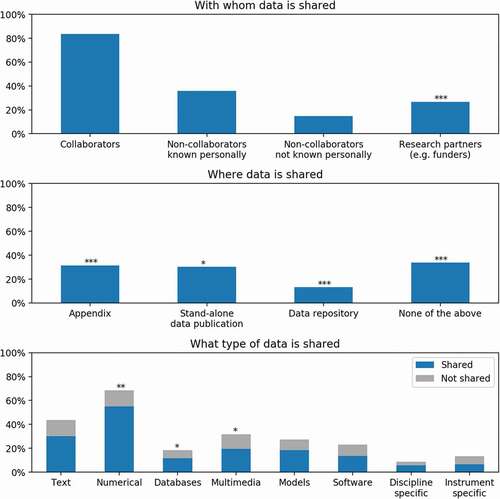
Figure 4. Comparison of data sharing among disciplines, highlighting life sciences and physics/astronomy.
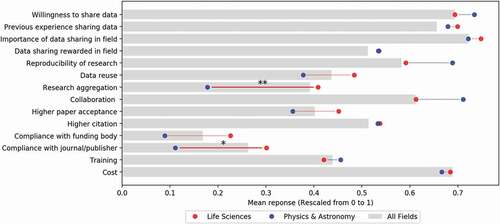
Table 4. Data collection sources for both Molecular Biology (MB) and High-Energy Physics (HEP)
Table 5. Theoretical progression of our analysis
Table 6. Similarities and differences observed between Reana (HEP) and open targets (MB)
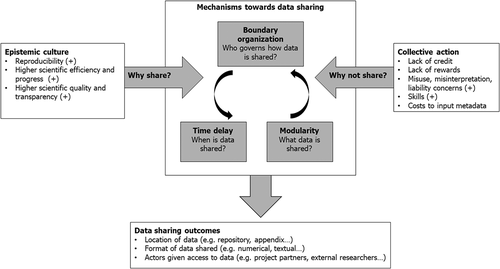
Figure 5. Mechanisms that enable HEP and MB researchers to share data. The (+) show significant motivator/deterrent of data sharing from our study.