Figures & data
Table 1. Descriptive Statistics and Correlations Among Dependent, Independent, and Background Variables.
Table 2. Correlations Among Dependent, Independent, and Background Variables Separately for Mothers and Fathers.
Table 3. Multilevel Analyses for Predicting Parents’ Work-Family Guilt in Nine European Countries (Control Variables in Appendix A).
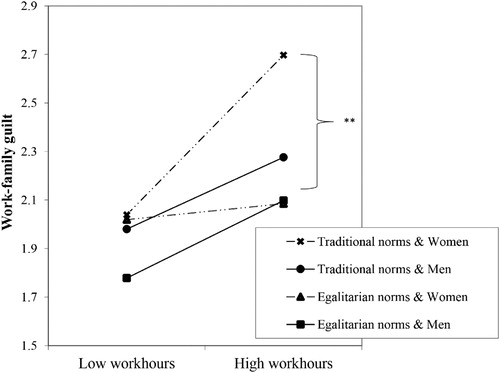
Figure 1. Fathers’ and mothers’ work-family guilt predicted by their traditional gender role beliefs (egalitarian = −1 SD; traditional = + 1 SD) and their working hours (low = −1 SD; high = + 1 SD). * p < .05; ** p < .01.
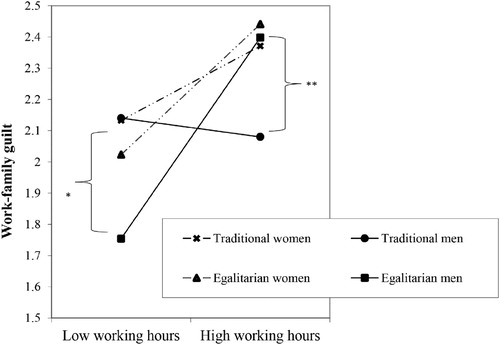
Figure 2. Fathers’ and mothers’ work-family guilt predicted by the gender norms of their organization (egalitarian = −1 SD; traditional = + 1 SD) and their working hours (low = −1 SD; high = + 1 SD). * p < .05; ** p < .01.