Figures & data
Figure 1. Unadjusted proportions of employee health and well-being outcomes, by workplace inclusiveness. Source: SHRM National Study of the Changing Workforce 2016.
Note: <Q1 and >Q3 respectively denote the proportion of employees reporting the adverse outcome in workplaces with scores below the 1st quartile and in workplaces with scores above the third quartile of the distribution of overall inclusiveness scores. (N for <Q1 subsamples=352–369 and N for >Q3 subsamples=358–365). ***p < 0.001, **p < 0.01, *p < 0.05, +p < 0.10. Please see Appendix C for unadjusted proportions of employee outcomes, by each of the four workplace components of workplace inclusiveness.
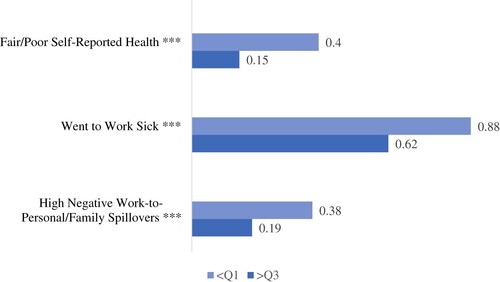
Figure 2. Mean health outcomes and differences by adverse/challenging life-events. Source: SHRM National Study of the Changing Workforce 2016.
Note: Adverse life events refer to at least one of the following in the past 12 months –close relative or friend passed away, had a serious illness, started caregiving for someone with a serious illness/ health condition, was unemployed for part of the year, close coworkers were laid off, or spouse was laid off. N = 1413 (adverse life-event subsample = 762, no adverse life-event subsample = 651). ***p < 0.001, **p < 0.01, *p < 0.05, +p < 0.10.
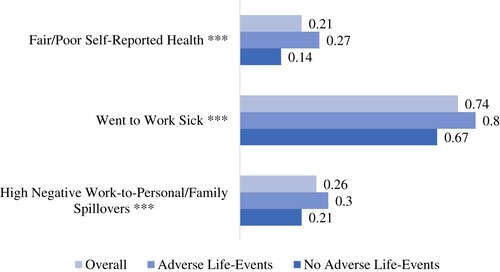
Table 1. Odds ratios from logistic regressions of employee outcomes on inclusiveness.
Figure 3. Adjusted proportions of employee health/well-being outcomes, by overall workplace inclusion scores. A. Fair/ Poor self-rated health. B. Presenteeism. C. Negative work-to-personal/family spillover. Source: National Study of the Changing Workforce 2016.
Note: Predicted probabilities from logistic regression of fair/poor self-rated health on inclusiveness score, adjusted for age, sex, race/ethnicity, education, partner, caregiver, occupation, fulltime, schedule, sector, earnings, industry, financial security and health condition. Regressions use survey sampling weights.
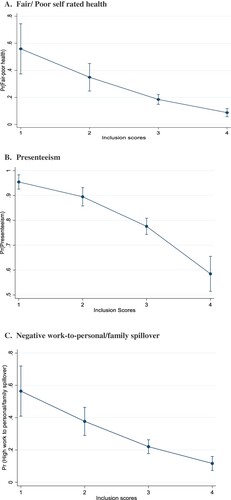
Figure 4. Workplace inclusion and self-rated health – comparison of employees with and without adverse life-events. A. Probability of fair/poor health by life-events and workplace inclusion. B: Difference between employees with and without life-events in probability of fair/poor health (95% confidence interval), by workplace inclusion. Source: SHRM National Study of the Changing Workforce 2016.
Note: N = 1413 (adverse life-event = 762, no adverse life-event = 651). Predicted probabilities from logistic regression of fair/poor self-rated health on inclusiveness score, adjusted for age, sex, race/ethnicity, education, partner, caregiver, occupation, fulltime, schedule, sector, earnings, industry, financial security and health condition. Regressions use survey sampling weights. Dashed lines show 95% confidence intervals. Differences are not significant where dashed lines touch 0.
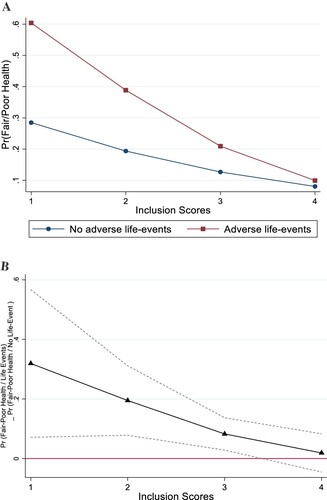
Figure 5. Workplace inclusion and going to work sick (presenteeism) – comparison of employees with and without adverse life-events. A. Probability of presenteeism by life-events and workplace inclusion. B. Difference between employees with and without life-events in probability of presenteeism (95% confidence interval), by workplace inclusion. Source: SHRM National Study of the Changing Workforce 2016.
Note: N = 1413 (adverse life-event = 762, no adverse life-event = 651). Predicted probabilities from logistic regression of presenteeism on inclusiveness score, adjusted for age, sex, race/ethnicity, education, partner, caregiver, occupation, fulltime, schedule, sector, earnings, industry, financial security and health condition. Regressions use survey sampling weights. Dashed lines show 95% confidence intervals. Differences are not significant where dashed lines touch 0.
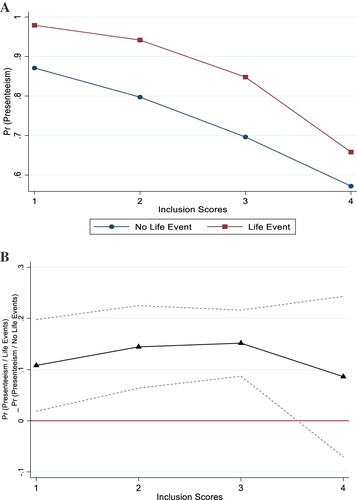
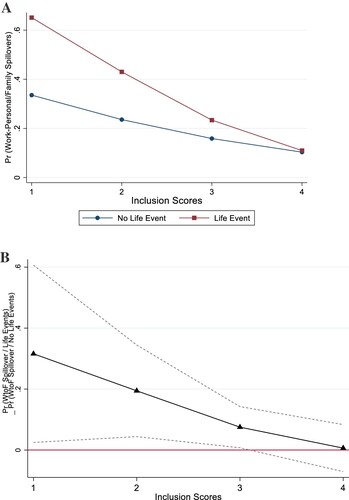
Figure 6. Workplace inclusion and work-to-personal/family spillover – comparison of employees with and without adverse life-events. A. Probability of work-to-personal/family spillover by life-events and workplace inclusion. B: Difference between employees with and without life-events in probability of work-to-personal family spillover (95% confidence interval), by workplace inclusion. Source: SHRM National Study of the Changing Workforce 2016.
Note: N = 1413 (adverse life-event = 762, no adverse life-event = 651). Predicted probabilities from logistic regression of high negative work-to-personal/family spillover on inclusiveness score, adjusted for age, sex, race/ethnicity, education, partner, caregiver, occupation, fulltime, schedule, sector, earnings, industry, financial security and health condition. Regressions use survey sampling weights. Dashed lines show 95% confidence intervals. Differences are not significant where dashed lines touch 0.