
Figures & data
Table 1. Classifications of ambiguous and unambiguous employment status based on three indicators.
Figure 1. Share of respondents in one of the ambiguous categories by demographic.
Source: UK LFS, 4th quarter 2018, n = 29,504, calibration weights; underlying data for the figure are presented in .
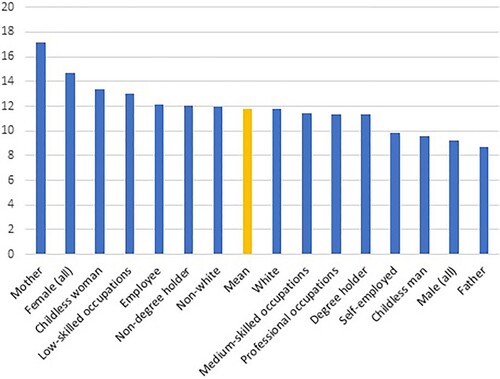
Figure 2. Marginal effects of parenthood on the probability of reporting into one of the ambiguous categories by gender and occupational class.
Source: UK LFS, 4th quarter 2018, n = 29,504, calibration weights.
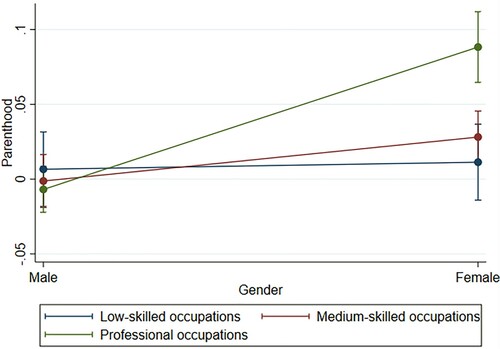
Table 2. Probabilities of reporting ambiguously across gender, parenthood status and occupational class.
Table 3. Distribution of different demographics across the ambiguous and unambiguous categories.
Table 4. Marginal effects of socio-demographic characteristics for selection into ambiguous categories
Table 5. Couples where at least one partner had an 'ambiguous' employment status.