
Figures & data
Figure 1. The theoretical model of the study.
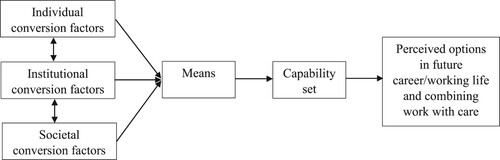
Table 1. Descriptive statistics for the studied variables.
Table 2. Model fit indices for the estimated latent profile solutions.
Figure 2. The latent profiles of young women’s expectations about their future career/working life.

Table 3. Proportions and conditional means of the latent profiles of young women’s expectations about their future career/working life.¹
Table 4. Descriptive statistics of socioeconomic and partnership characteristics, work-family expectations and control variables for the latent profiles of young women’s expectations about their future career/working life. Means (M) and standard deviations (SD) are computed for continuous variables and percentages (%) for categorical variables.
Table 5. Differences between latent profiles in relation to socioeconomic and partnership characteristics, work-family expectations and control variables. Mean differences, their 95% confidence intervals (CI) and effect sizes (Cohen’s d) are computed for the continuous variables and odds ratio (OR) and their 95% CI for the categorical variables.