
Figures & data
Figure 1. A model testing the bidirectional and reciprocal nature of work-family guilt.
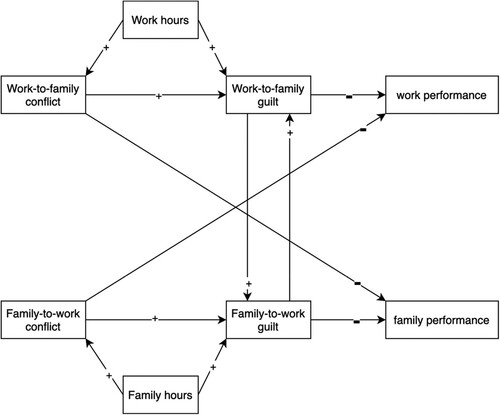
Table 1. Mean, standard deviation, and correlation of the variables (n = 627).
Table 2. Goodness-of-fit of the measurement of the proposed model.
Table 3. Goodness-of-fit of the proposed model.
Figure 2. Final model with the regression coefficients labelled for each path.
Note. Broken lines represent non-significant paths, the curved line represents the covariance, * p < .05, ** p < .01, *** p < .001.
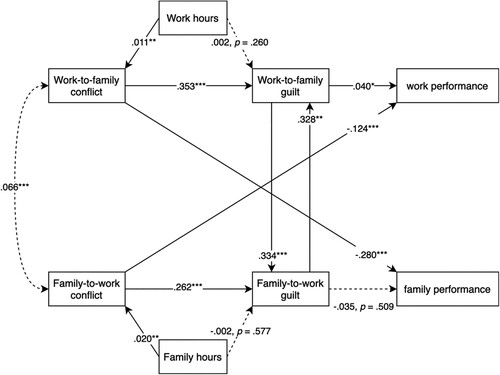
Table 4. Summary of the parameter estimates and covariance of the latent variables.