
Figures & data
Figure 1. Sampling criterion for the 1993, 2001 and 2008 cohorts of single mothers.
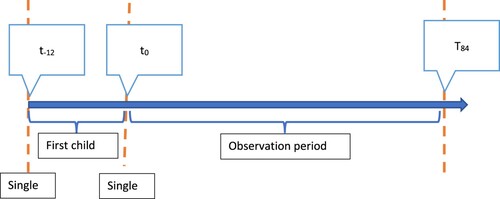
Table 1. Status alphabet of three channels.
Figure 2. State distribution over three channels.
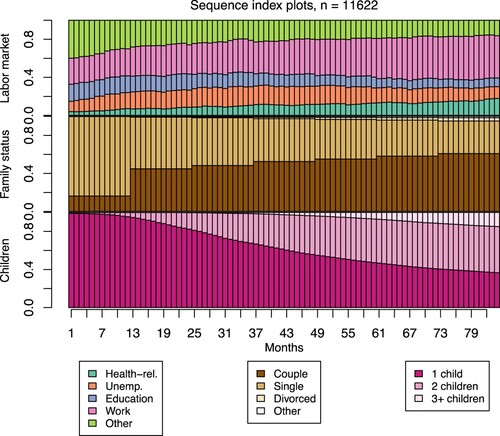
Table 2. Average status duration and distribution in 84th month.
Figure 3. Mantel correlation coefficients of life domains and cohort.
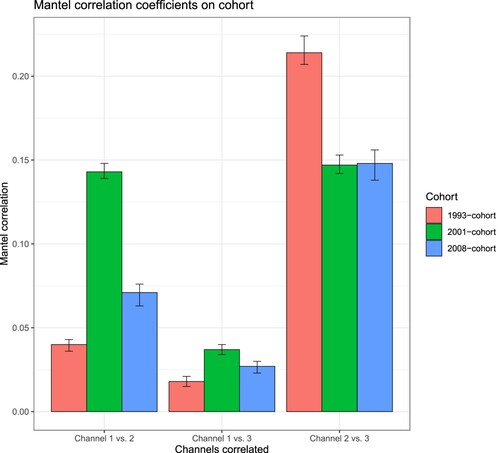
Figure 4. Mantel correlation coefficients of life domains and age of becoming a single mother.
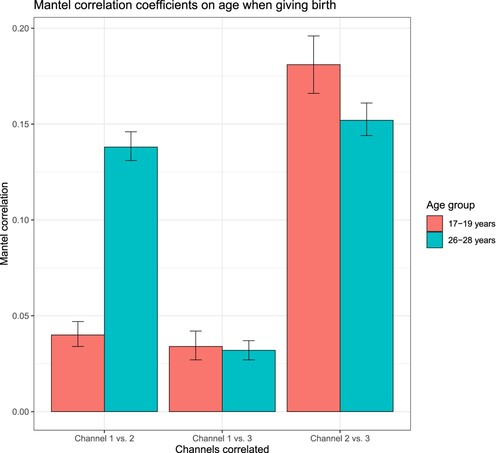
Table 3. Trajectory types and characteristics.
Figure 5. Average marginal effects from selected covariates on the probability of following Clusters 1–4. Note: Age effects are in the regressions interpreted in five-year units. Reference categories for dummy variables are found within brackets.
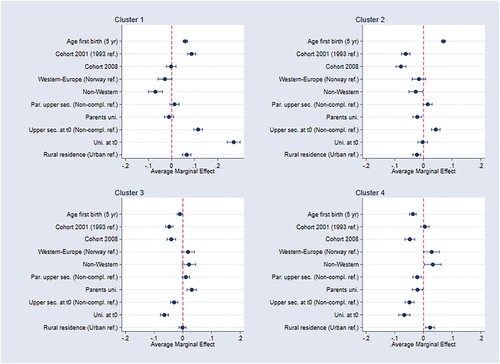
Figure 6. Average marginal effects from selected covariates on the probability of following Clusters 5–7. Note: Age effects are in the regressions interpreted in five-year units. Reference categories for dummy variables are found within brackets.
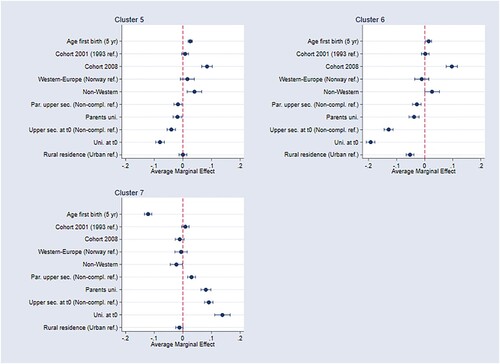
Table 4. Descriptive statistics.
Figure A1. Cluster 1, sequence index plot (left) and chronograms (right)*.
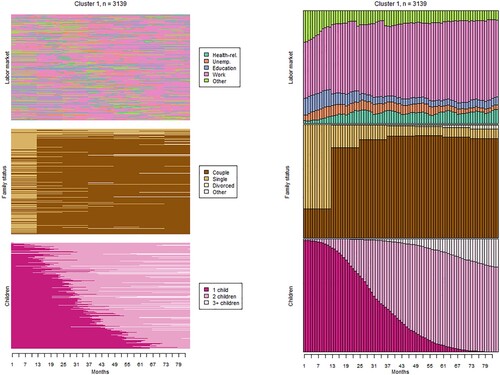
Figure A2. Cluster 2, sequence index plot (left) and chronograms (right)*.
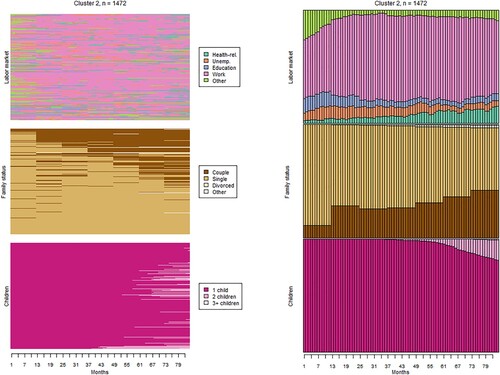
Figure A3. Cluster 3, sequence index plot (left) and chronograms (right)*.

Figure A4. Cluster 4, sequence index plot (left) and chronograms (right)*.
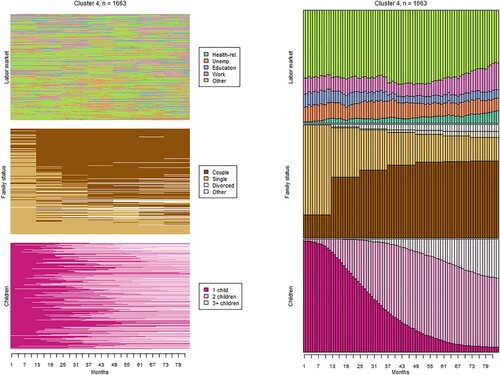
Figure A5. Cluster 5, sequence index plot (left) and chronograms (right)*.
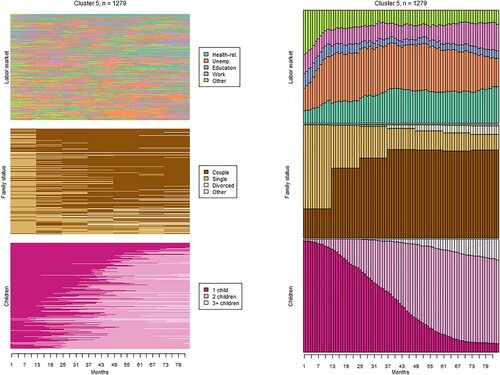
Figure A6. Cluster 6, sequence index plot (left) and chronograms (right)*.
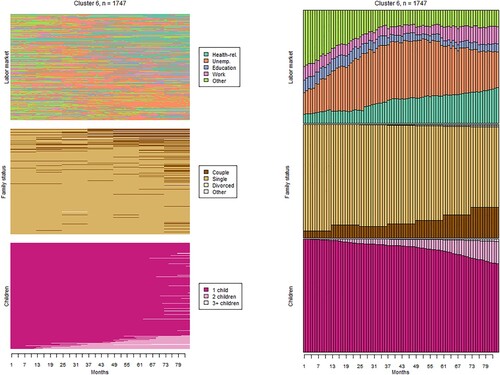
Figure A7. Cluster 7, sequence index plot (left) and chronograms (right)*.
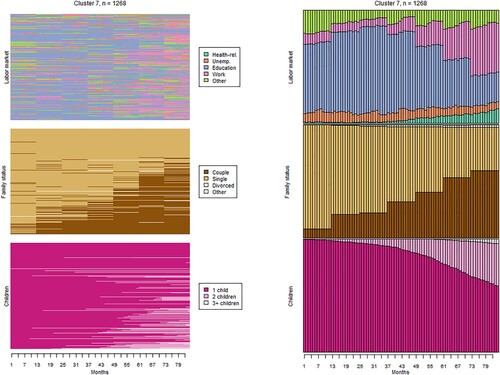
Table A1. Multinoimial regression, average marginal effects.