Figures & data
Table 1. Brief description of IT-based risk/threat/maturity models, their advantage and disadvantages, and their relation to our proposed QBowtie model.
Figure 1. Outline of QBowtie method for risk classification.
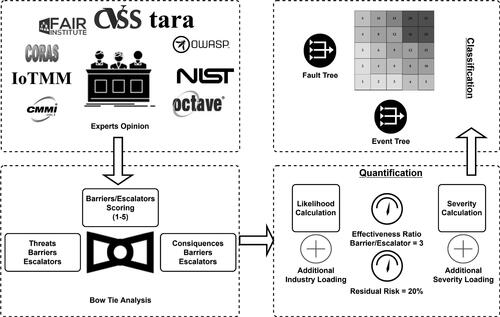
Table 2. Additional Industry Loadings. (AIG and Claims Intelligence Series 2016).
Table 3. Additional Severity Loading by Sector. Data Source: (Ponemon Institute Citation2020).
Figure 2. Experts median scores for threat barriers.
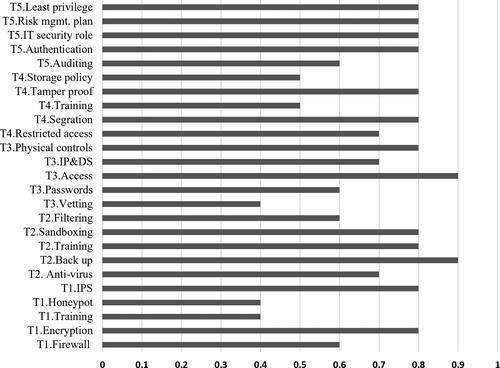
Figure 3. Experts median scores for threat escalators.
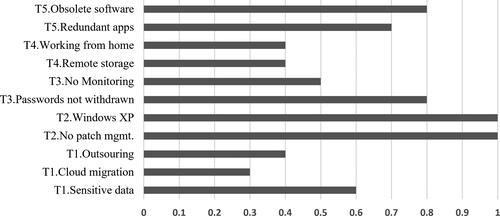
Figure 4. Experts median scores for consequence barriers.
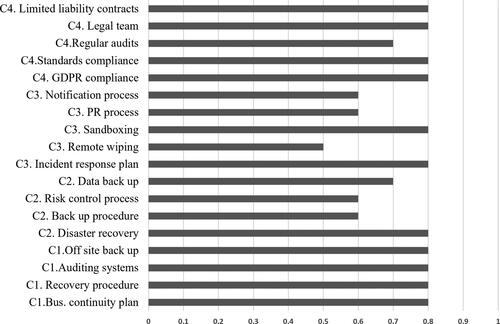
Figure 5. Experts median scores for consequence escalators.
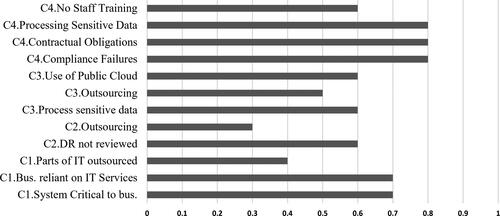
Figure 6. Left hand side of bow-tie diagram for top event Data Breach illustrating threats (rectangles), barriers (ovals) and escalators (hexagons).
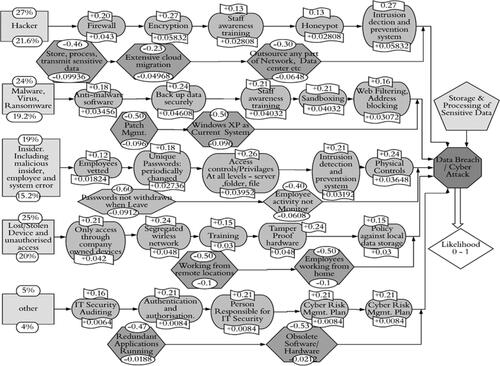
Figure 7. Right hand side of Bowtie diagram for top event Data Breach illustrating consequences (rectangles), barriers (ovals) and escalators (hexagons).
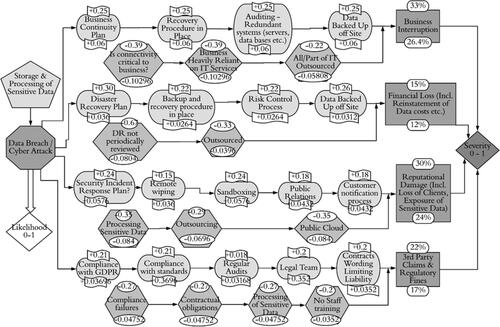
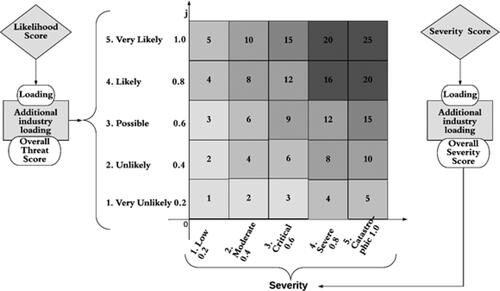
Figure 8. Cyber risk Matrix. The Threat is on the vertical axis, while the severity is on the horizontal. The combined score is mapped to a quadrant, and the top right represents the riskiest company, while the bottom left represents the least risky company.