
Figures & data
Figure 1. Structure of stimulus material within the 3 [comparative risk information: personalized risk-only, personalized risk above average, and personalized risk below average] × 2 [format: numerical-only, numerical + visual) between-subject design, shown for male participants receiving risks about neuropathy after chemotherapy for colon cancer. Participants either received their personalized risk without comparative data, or they received their personalized risk together with a lower generic risk or together with a higher generic risk.
![Figure 1. Structure of stimulus material within the 3 [comparative risk information: personalized risk-only, personalized risk above average, and personalized risk below average] × 2 [format: numerical-only, numerical + visual) between-subject design, shown for male participants receiving risks about neuropathy after chemotherapy for colon cancer. Participants either received their personalized risk without comparative data, or they received their personalized risk together with a lower generic risk or together with a higher generic risk.](/cms/asset/d56619b3-8c17-4510-b9c2-133b0c403d8d/rjrr_a_2128392_f0001_c.jpg)
Figure 2. Flowchart of the data collection process.
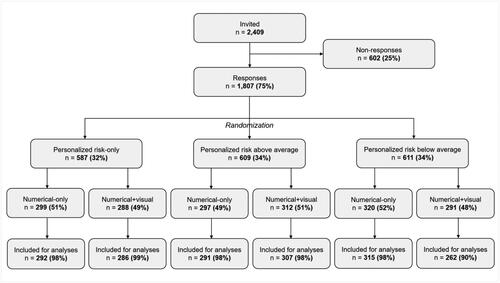
Table 1. Sociodemographic characteristics of respondents and non-respondents.
Table A1. Sociodemographic characteristics and individual difference scores by experimental condition.
Figure 3. Risk estimates as a function of comparative risk strategy, shown for all three health scenarios.
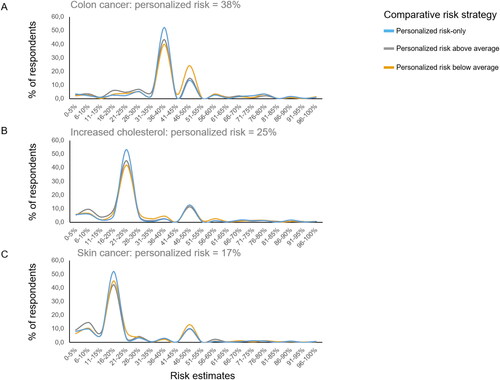
Table 2. Participants’ mean scores on the primary and secondary outcomes in the colon cancer scenario across all experimental conditions.
Table B1. Main and interaction effects on primary outcome measures resulting from a 3 × 2 MANCOVA and on the secondary outcome variables resulting from two separate 3 × 2 ANCOVAs for the colon cancer scenario.
Table 3. Participants’ mean scores on the primary and secondary outcomes in the increased cholesterol scenario across all experimental conditions.
Table B2. Main and interaction effects on primary outcome measures resulting from a 3 × 2 MANCOVA and on the secondary outcome variables resulting from two separate 3 × 2 ANCOVAs for the increased cholesterol scenario.
Table 4. Participants’ mean scores on the primary and secondary outcomes in the skin cancer scenario across all experimental conditions.
Table B3. Main and interaction effects on primary outcome measures resulting from a 3 × 2 MANCOVA and on the secondary outcome variables resulting from two separate 3 × 2 ANCOVAs for the skin cancer scenario.
Data availability statement
The data can be accessed via https://tiu.nu/osf/q2dcz.