
Figures & data
Figure 1. Treatment effects on selected PMT constructs (**p <.001; 95% CIs).
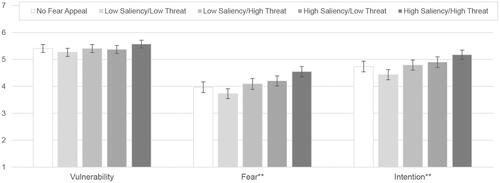
Figure 2. Effects of independent variables on selected PMT constructs (*p <.05, **p <.001; 95% CIs).
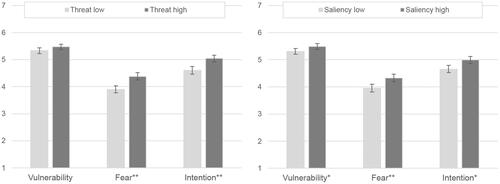
Figure 3. Decline rates across the experimental conditions (95% CIs).
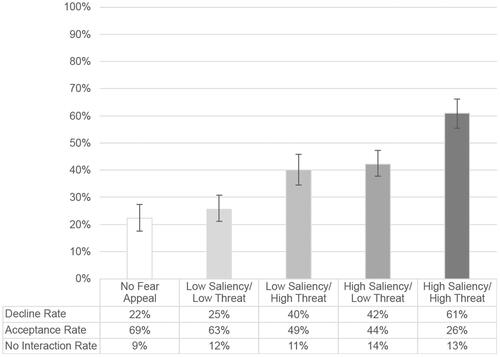
Figure 4. Decision time across the experimental conditions (95% CIs).
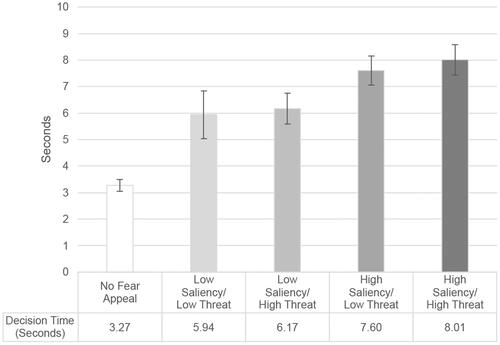
Figure A1. Cookie tracking likelihood and concern rated by the participants (with 95% CIs).
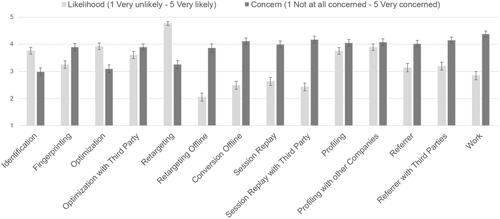
Table A1. Demographics of the sample in the main experiment.
Figure A2. Stimulus homepage as displayed to the participants.
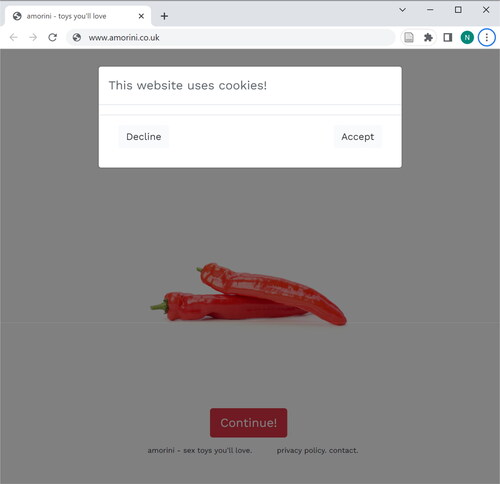
Table A2. Measures for PMT constructs.
Table 1. Illustration of experimental stimuli in each condition.
Table 2. Manipulation checks measured immediately after the experimental task.
Table 3. Logistic regression for decline rate.
Data availability statement
The raw data are available via https://osf.io/vr6b7/