
Figures & data
Figure 1. Panel A: COVID-19 incidence in Germany across a two-year time period, starting in March 2020 (the onset of the pandemic in Germany). Vertical dashed lines mark key events: lockdowns, beginning of vaccination rollout, and vaccination progress. The numbers from 1 to 17 indicate the survey waves. Panel B: Average risk judgments in each of the 17 survey waves, plotted separately for ‘direct experience’ and ‘no experience’ of a COVID-19 infection. Error bars represent bootstrapped 95% CIs.
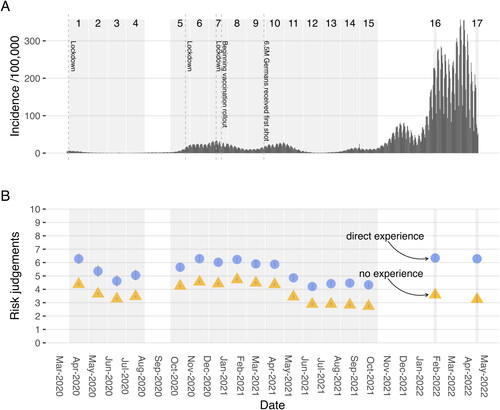
Figure 2. Average risk judgments in each of the 17 survey waves, plotted separately for (in)direct experience and no experience of COVID-19 infection. Error bars represent bootstrapped 95% CIs.
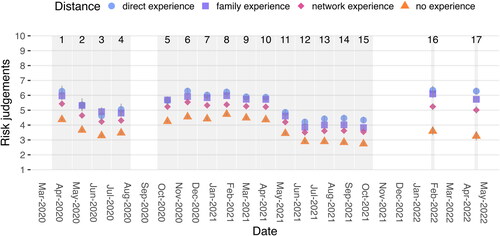
Figure 3. Proportions of participants with each category of experience across the 17 survey waves.
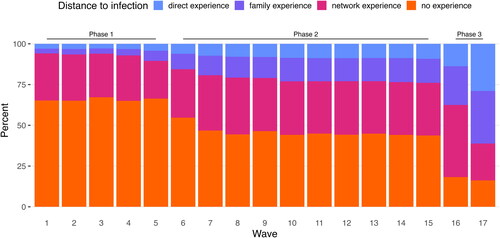
Figure 4. Panel A: Media mentions of ‘COVID*’ and ‘Corona*’ in major German print and online media outlets. Panel B: Sentiment analysis for positive and negative words found in Bild.de and Spiegel.de. Panel C: Google searches for ‘Corona*’ in Germany.
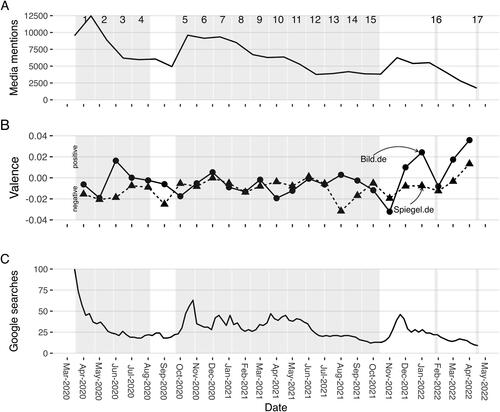
Figure 5. Risk judgments across seven age groups. Error bars represent bootstrapped 95% CIs.
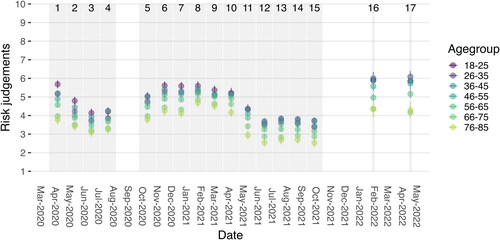
Figure 6. Average fear ratings, plotted separately for ‘direct experience’ and ‘no experience’ of a COVID-19 infection. Error bars represent bootstrapped 95% CIs.
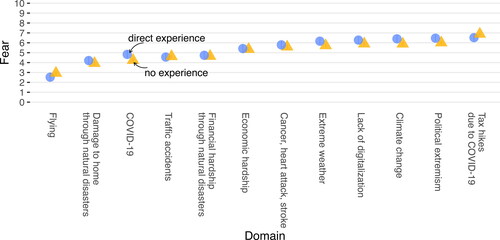
Figure A1. Fear of a life-threatening disease by age group. Error bars represent bootstrapped 95% CIs.
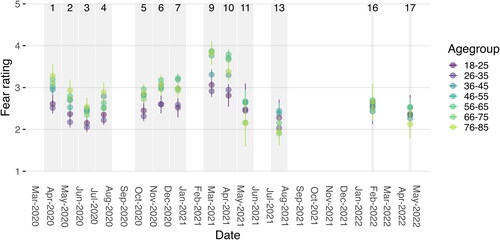
Table A1. Demographic characteristics of participants (N = 15,015).
Table A2. Number of participants per wave.
Table A3. Multilevel model predicting risk judgment by experience of infection (two-way split: direct or no experience).
Table A4. Multilevel model predicting risk judgment by experience of infection (four-way split: direct, family, network, or no experience).
Table A5. Multilevel model predicting risk judgments by media mentions and google searches.