
Figures & data
Figure 1. Mean frequencies of L1 and L2 inner speech use.
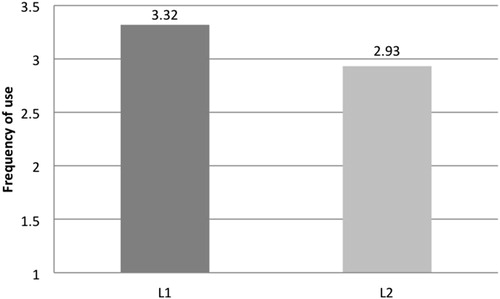
Table 1. Overall difference in frequency of L1 and L2 in inner speech (Wilcoxon Signed Ranks Test).
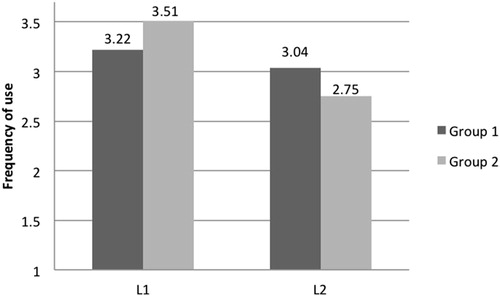
Figure 2. Mean frequencies of L1 and L2 inner speech use depending on current country of residence.
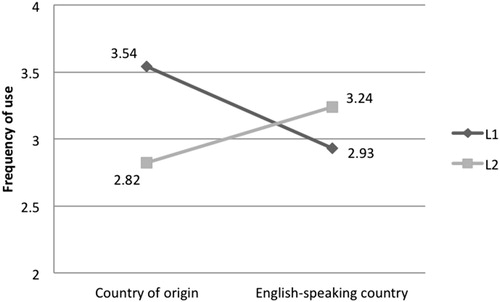
Table 2. Difference in frequency of using the L1 and L2 in inner speech depending on current country of residence.
Table 3. Links between demographic variables and using L1 and L2 inner speech.
Figure 3. Mean frequencies of L1 and L2 in inner speech use depending on the self-reported frequency of using English.
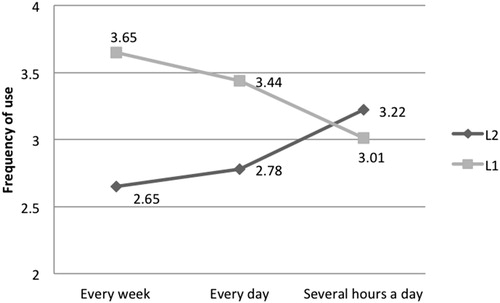
Table 4. Differences in frequency of using the L1 and L2 in inner speech based on self-reported frequency of using the L2.
Table 5. Links between language-related variables and the frequency of using the L1 and L2 in inner speech.
Figure 4. Mean frequencies of L1 and L2 inner speech use depending on the overall number of languages known.
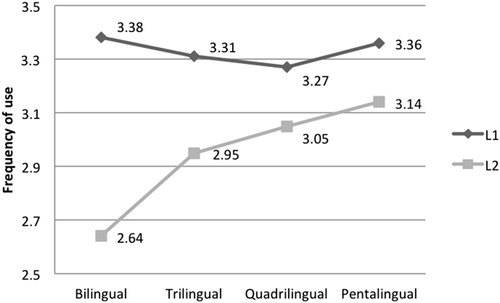
Figure 5. Mean frequencies of L1 and L2 inner speech use depending on self-reported language dominance.
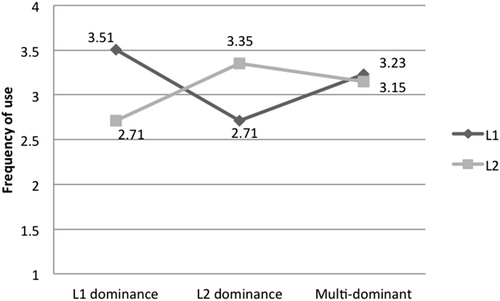
Figure 6. Mean frequencies of L1 and L2 inner speech use: Western and non-Western L1 background.
Data availability statement
The data that support the findings of this study are available from the corresponding author, P.R., upon reasonable request.