Figures & data
Table 1. Descriptive statistics and correlations.
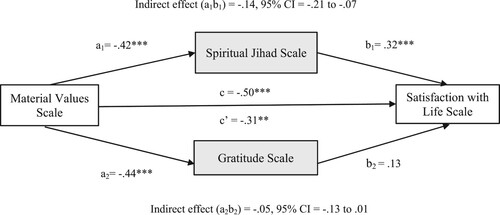
Figure 1. Response distributions for variables.
Note: The violin charts display response distributions, with box plots marking the 25th and 75th percentiles and a bolded line for the median. Vertical lines indicate values within 1.5 times the interquartile range. The data suggests a normal competence distribution in the control condition, as Skewness and Kurtosis range between –1 and +1. Metrics for select variables include Materialism (Median: 2.86, SD: .54), Gratitude (Median: 5.83, SD: .78), Life Satisfaction (Median: 4.80, SD: 1.10), and Spiritual Jihad (Median: 5.96, SD: 1.04).
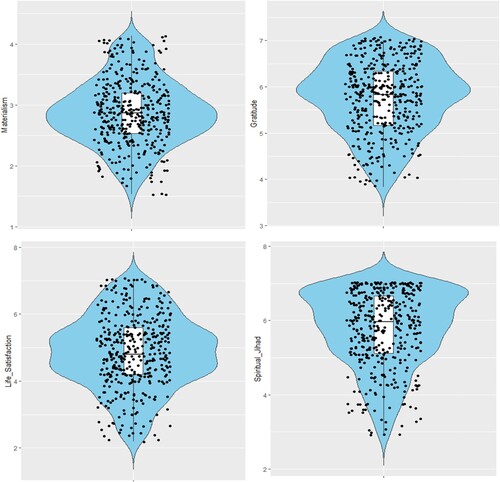
Figure 2. Multiple mediation model results.