
Figures & data
Table 1. Demographic features of the participants (N = 267).
Table 2. Mann–Whitney U Test results for participants with weak faith versus strong faith on flourishing and CORE-10.
Table 3. Model summary of the regression analysis on predictors of CORE-10.
Table 4. Coefficients table looking at predictors of CORE-10.
Figure 1. A Path model of flourishing, religious faith and psychological distress.
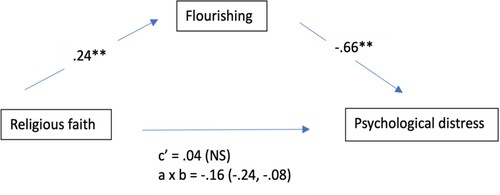
Table 5. Spearman’s rho correlations coefficient between flourishing score, Santa Clara score, and CORE-10 score.
Table 6. Results for mediation analyses (N = 257).