Figures & data
Figure 1. Research design and input data for the modal shift calculations in the macro and micro studies.
Table 1. Data sources and their role in the studies.
Table 2. Cost efficiency per product group for increased weight limits from 60 t/25.25 m to 74 t/25.25 m, and for increased weight and length limits from 60 t/25.25 m to 74 t/34 m.
Table 3. Tonne-kilometres for different types of trains in 1,000,000 tonne-kilometres (Tabell D:10, Trafikanalys Citation2015).
Table 4. Estimated allocation of tonne-kilometres per product group to different types of trains.
Table 5. Characteristics of COOP’s distribution network.
Table 6. Modal shift from rail to road in 2030 when implementing 74 t/25.25 m vehicles (in 1,000,000 tonne-km).
Table 7. Modal shift from rail to road in 2030 when implementing 74 t/34 m vehicles (in 1,000,000 tonne-km).
Table 8. Cost and CO2 effects of HCVs in three scenarios.
Figure A1. Transport flows on road, rail and sea in Sweden (courtesy of the magazine Transportnytt 2017).
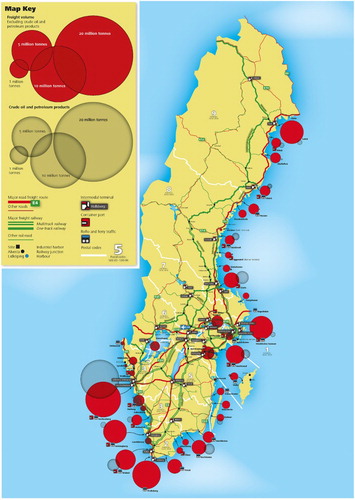
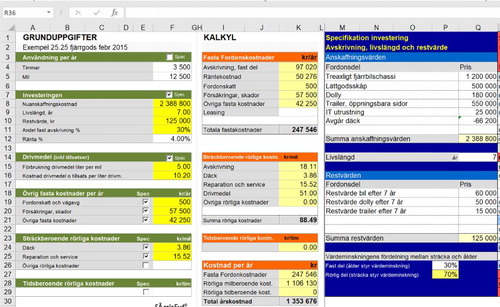
Figure A2. A screenshot from SÅ Calc provided by the Swedish Association of Road Transport Companies and used to calculate the cost parameters for the macro and micro studies.