Figures & data
Table 1. Average hourly labour costs in € in Europe for selected countries (Eurostat Citation2017).
Figure 1. The app, named after the study (Cabotagestudien, available at the App Store and Google Play). Volunteers download the app, register licence plate numbers and add comments on nationality, for example.
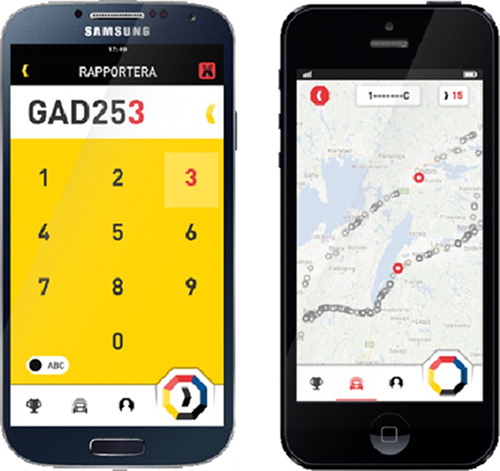
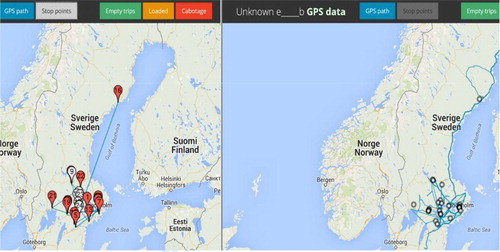
Figure 2. The left image shows the movement pattern of a truck, based on volunteer observations. The right image shows the actual movement pattern of the same truck, based on the GPS of the fleet management system of the haulier (Sternberg et al. Citation2015).