Figures & data
Figure 1. Distribution channel layouts (based on Kuipers and Eenhuizen Citation2004, adapted).
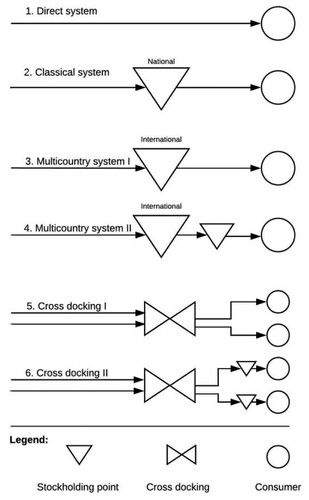
Table 1. Characteristics of fashion case interviews.
Table 2. Characteristics of consumer electronics (CE) case interviews.
Table 3. Characteristics of online retail (OR) case interviews.
Table 4. Sum of mentions of subfactors per main factor and sector.
Figure 2. Ranking of main factors based on scores corrected for splitting bias.
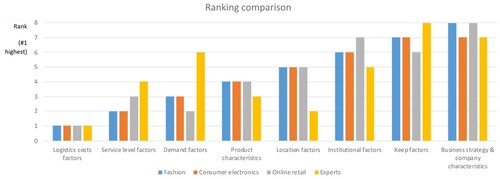
Figure 3. Correlations of main factor scores between sectoral decision-makers (left) and between sectoral decision-makers and previous BWM research by Onstein et al. (Citation2019b) (right).
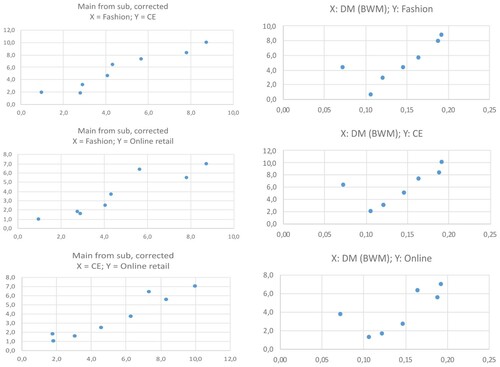
Figure 4. Service level subfactor importance (0 = low, 1 = high).
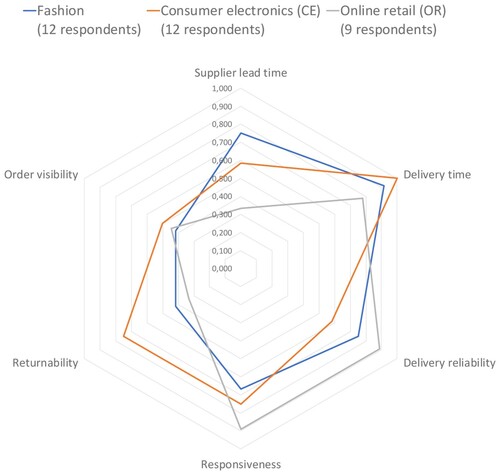
Figure 5. Logistics costs subfactor importance (0 = low, 1 = high).
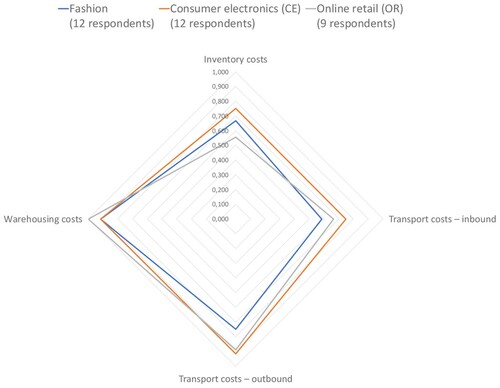
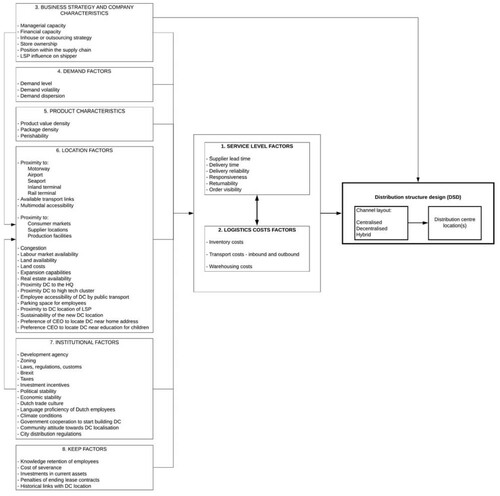
Table 5. Factors influencing distribution structure design (DSD) according to case interviews.
Figure 6. Demand subfactor importance (0 = low, 1 = high).
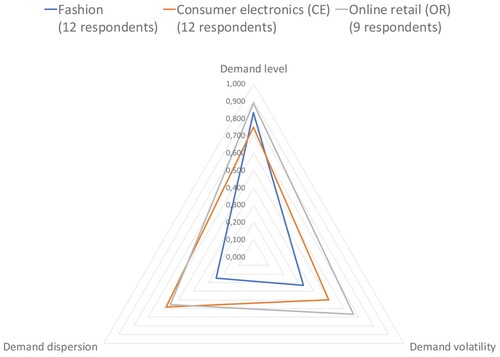
Figure 7. Product characteristics subfactor importance (0 = low, 1 = high).
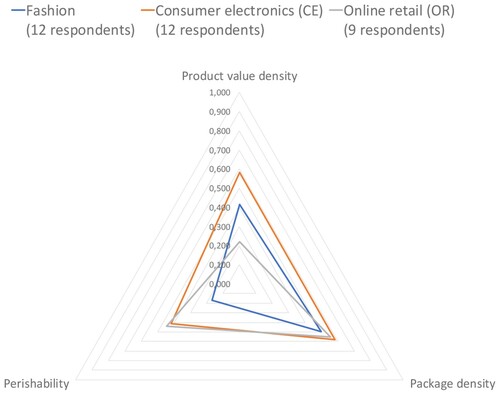
Figure 8. Location subfactor importance (0 = low, 1 = high).
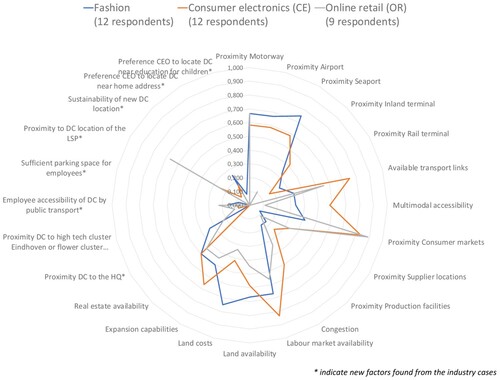
Figure 9. Institutional subfactor importance (0 = low, 1 = high).
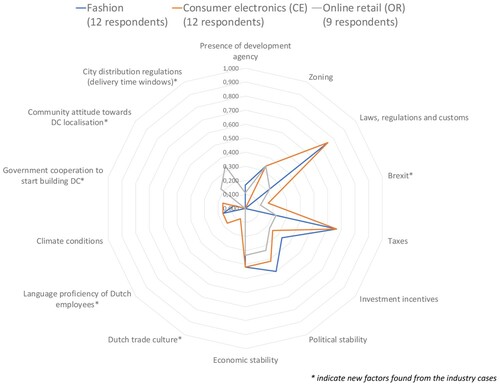
Figure 10. Validated conceptual framework.