4,074
Views
10
CrossRef citations to date
0
Altmetric
Articles

A systematic mapping review exploring 10 years of research on supply chain resilience and reconfiguration

, , &
Pages 1191-1218 | Received 05 Jan 2020, Accepted 14 Feb 2021, Published online: 10 Mar 2021

Figures & data

Figure 1. Systematic mapping study process (adapted from Petersen et al., Citation2008).

Figure 1. Systematic mapping study process (adapted from Petersen et al., Citation2008).

Table 1. Systematic mapping review questions.

Table 2. Structure of questions for systemic mapping review.

Figure 2. The systematic mapping review process.

Figure 2. The systematic mapping review process.

Table 3. Inclusion and Exclusion criteria.

Table 4. Search results.

Table 5. Data Extraction.

Figure 3. The distribution of the articles by subject.

Figure 3. The distribution of the articles by subject.

Figure 4. The distribution of the articles over time.

Figure 4. The distribution of the articles over time.

Figure 5. The distribution of the articles by journal.

Figure 5. The distribution of the articles by journal.

Figure 6. Country covered by the study (32 studies).

Figure 6. Country covered by the study (32 studies).

Figure 7. Geographical region covered by the study (32 studies).

Figure 7. Geographical region covered by the study (32 studies).

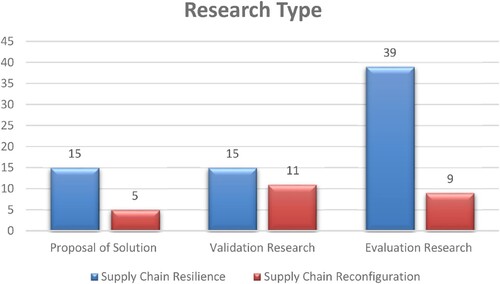
Table 6. Classification of research type (Petersen et al., Citation2015).

Figure 8. Categories of research method.

Figure 8. Categories of research method.

Figure 9. Research type (Petersen et al., Citation2008).

Figure 9. Research type (Petersen et al., Citation2008).

Table 7. Definitions of supply chain resilience set out in the studies.

Figure 10. Supply chain resilience enablers.

Figure 10. Supply chain resilience enablers.

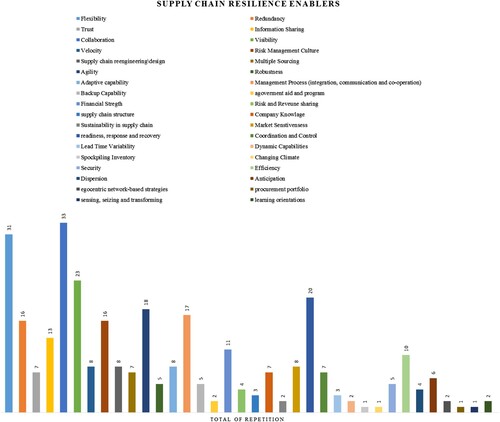
Table 8. Supply chain resilience enablers.

Table 9. Supply chain reconfiguration characteristics.