Figures & data
Figure 1. Status proportion plots of young people’s employment trajectories and household trajectories. Source: SOEPlong 1993–2012; own calculations.
Note: (M) represents male clusters and (F) female clusters.
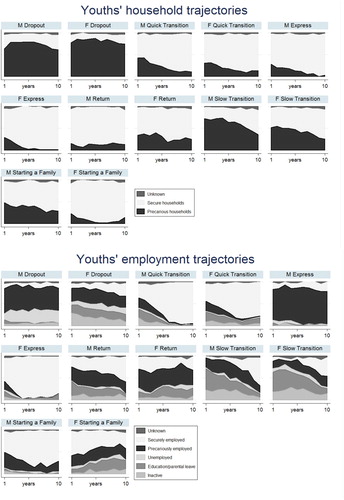
Table 1. Cluster descriptions of the individual and household trajectories.
Figure 2. The association between young people’s integration and precarious employment. Source: SOEPlong 1993-2012; own calculations.
Note: (M) stands for male clusters and (F) for female clusters.
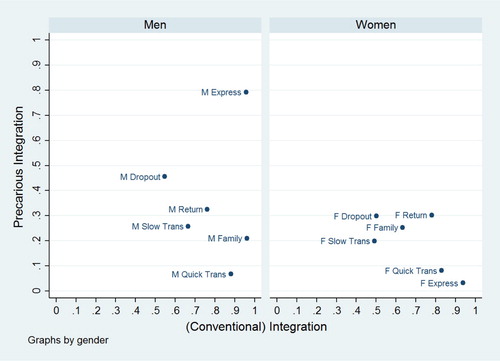
Figure 3. The association between young people’s integration and volatility. Source: SOEPlong 1993-2012; own calculations.
Note: (M) stands for male clusters and (F) for female clusters.
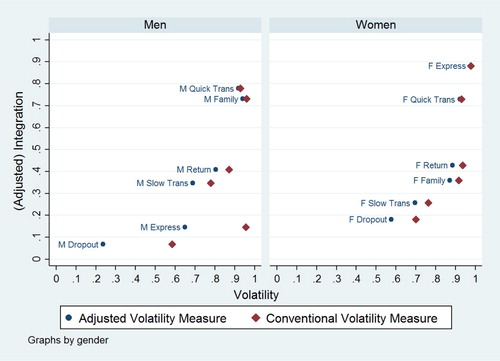
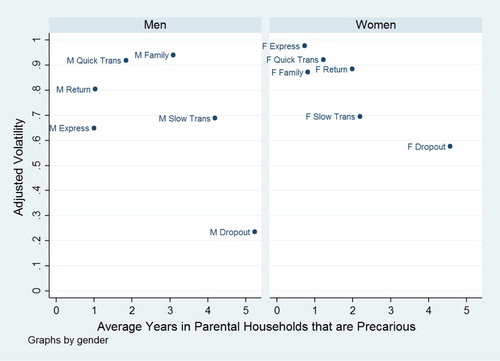
Figure 4. The association between young people's volatility and average years in precarious parental householdsSource: SOEPlong 1993-2012; own calculations.
Note: (M) stands for male clusters and (F) for female clusters.