
Figures & data
Table 1. Coding for dependent variables (Eurobarometer 375 Citation2013).
Figure 1. Levels of youth political participation across EU countries (Eurobarometer 375 Citation2013).
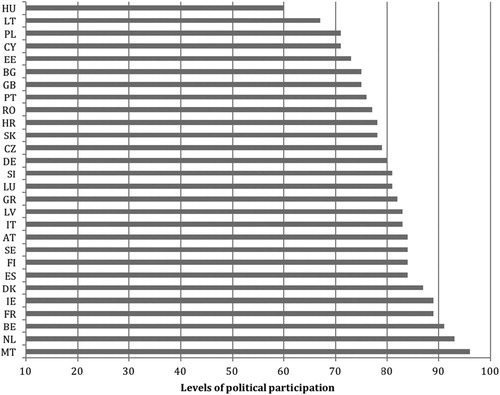
Figure 2. Proportion of respondents from different age group participating in formal politics compared to being members of organisations (Eurobarometer 375 Citation2013).
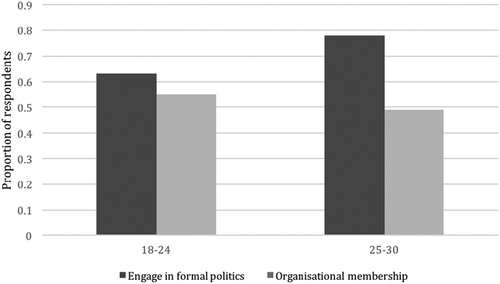
Table 2. Results from the logistic regression models of the propensity of young individuals to engage in politics with age a control variable: Formal political participation and organisational membership.
Table 3. Results from the logistic regression models of the propensity of young individuals to engage in politics with socio-demographic characteristics only: Model 1 (general political participation), Model 2 (formal political participation), and Model 3 (organisational membership).
Table 4. Results from the logistic regression models of the propensity of young individuals to engage in politics controlling for age of democracy: Model 4 (general political participation), Model 5 (formal political participation), and Model 6 (organisational membership).
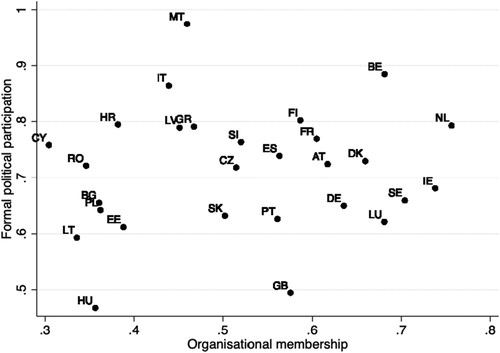
Figure 3. Average levels of political engagement in formal participation and organisational membership (Eurobarometer 375 Citation2013).
Supplemental material