Figures & data
Figure 1. Early school leavers across historical time and birth years and high school graduation rates over time.
Notes: (a) Eurostat, historical series; (b) Multi-purpose Survey on Household and Social Subjects 2009, authors’ calculations; (c) ISTAT - Italian National Statistical Institute, historical series. Splines estimates.
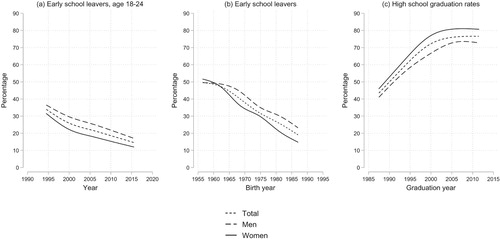
Figure 2. Unemployment rates and inactivity rated for selected age groups.
Note: ISTAT - Italian National Statistical Institute, historical series.
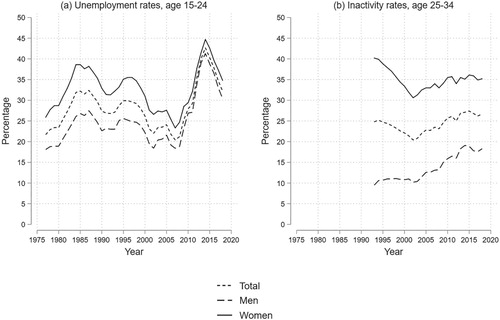
Table 1. Samples’ distribution.
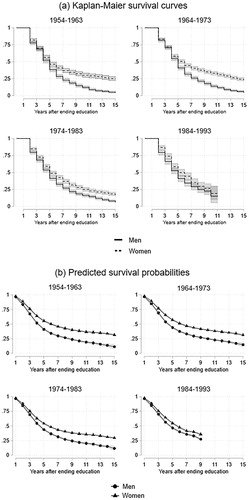
Figure 3. Early school leavers. Kaplan-Maier survival curves for entering the labor market for the first time after leaving the educational system by gender and birth cohort, 95% confidence intervals.
Note: Multi-purpose Survey on Household and Social Subjects 2009, authors’ calculations.
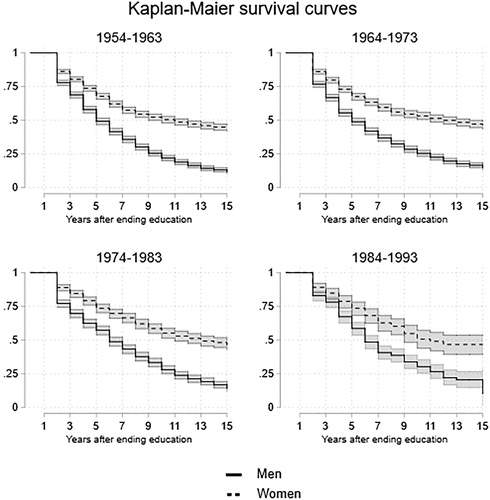
Table 2. Early school leavers. Discrete time logistic regression models: survival probabilities of entering the labor market for the first time after leaving the educational system. Odds ratios (standard errors in parentheses).
Figure 4. Early school leavers. Adjusted predicted survival probabilities for entering the labor market for the first time after leaving the educational system by gender and birth cohort, 95% confidence intervals.
Note: Multi-purpose Survey on Household and Social Subjects 2009, authors’ calculations.Note: estimates from Model 5 in .
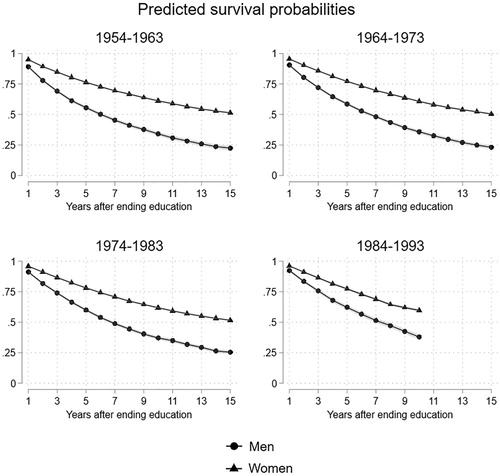
Table 3. Early school leavers. Discrete time multinomial logistic regression models of competing risk: relative-risk ratios of entering the labor market for the first time after leaving the educational system via specific employment arrangement. Odds ratios (standard errors in parentheses).
Table 4. Early school leavers. Discrete time multinomial logistic regression models of competing risk: relative-risk ratios of entering the labor market for the first time after leaving the educational system via specific working-hours arrangement. Odds ratios (standard errors in parentheses).
Figure A1. High school graduates. (a) Kaplan-Maier survival curves and (b) adjusted predicted survival probabilities for entering the labor market for the first time after leaving the educational system by gender and birth cohort, 95% confidence intervals.
Note: Multi-purpose Survey on Household and Social Subjects 2009, authors’ calculations.Note: estimates in (b) are from Model 3 in .