
Figures & data
Figure 1. POCC-OC-IQ model.
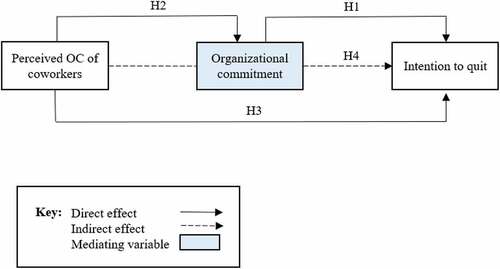
Table 1. Demographic characteristics.
Table 2. Means, standard deviations, and correlations.
Table 3. Overview of the mediating and moderating effects determined using multiple regression.
Table 4. Direct and indirect effects of the POCC-OC-IQ model.