Figures & data
Table. 1. Current clinical applications of 18F-FDG-FET subtraction techniques.
Figure 1. Image subtraction procedures.
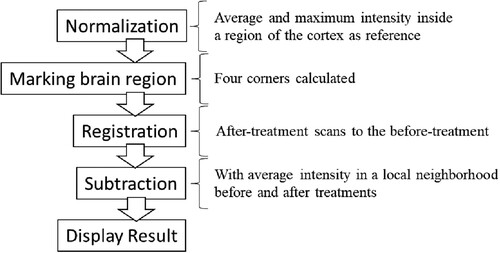
Figure 2. An example of image normalization.
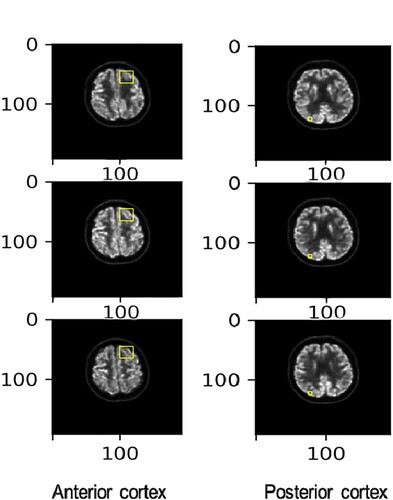
Figure 3. Nine potential situations of registration transformation.
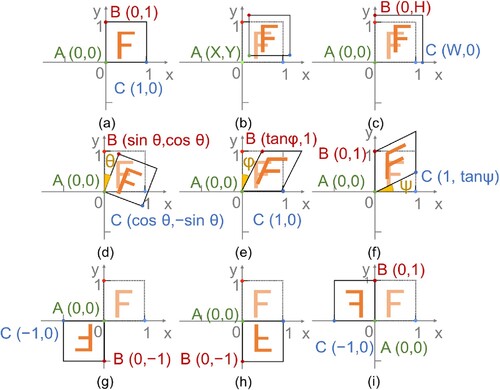
Figure 4. The scan image after registration.
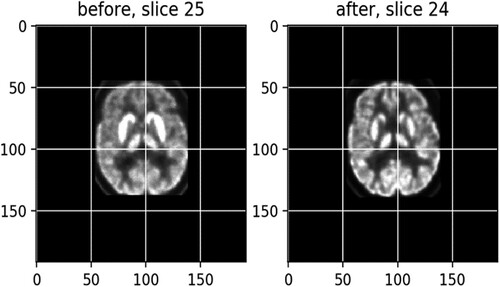
Figure 5. The 18F-FDG-PET data before and after treatment.
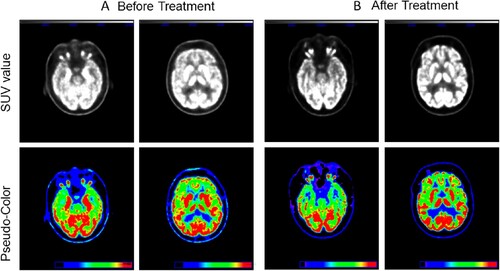
Figure 6. The normalization (a) and registration (b) images before and after treatment, with the anterior cortex used as the reference.
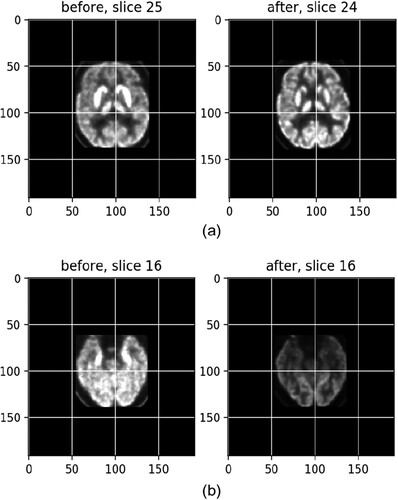
Figure 7. The normalization (a) and registration (b) images before and after treatment, with the posterior cortex used as the reference.
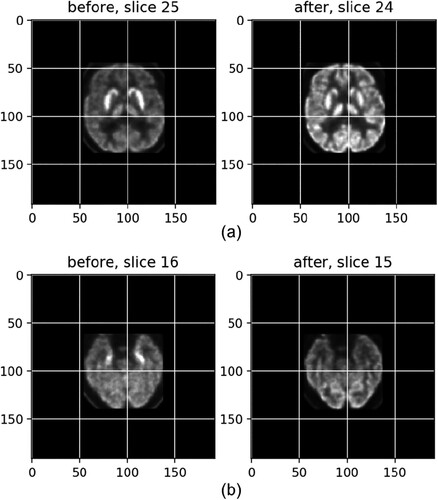
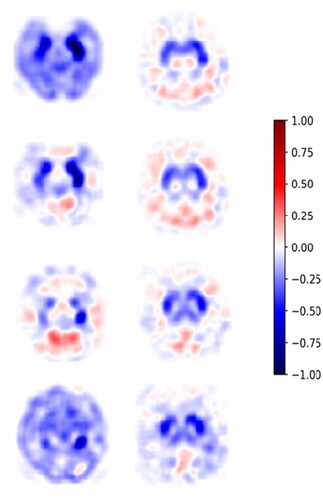
Figure 8. The subtraction result rendered at a cut-off of 0.1 (blue colour indicates the previous abnormal metabolic state).