Figures & data
Figure 1. The evolution of peer-reviewed climate change and skiing tourism literature.
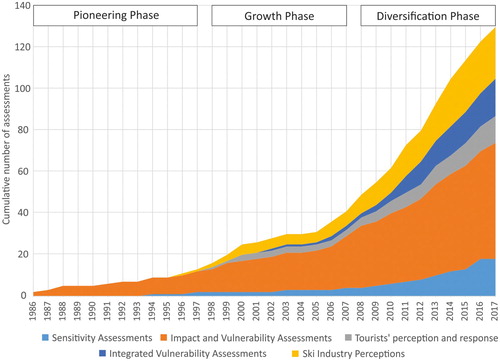
Table 1. Comparison of climate variability and change research in global ski tourism markets.
Table 2. A comparison of projected changes of ski season length and snow reliable ski areas in the 2050s.
Figure 2. Share of snow reliable ski areas in North American and European regions in a 2050s high emission scenario. Source (Data from Dawson & Scott, Citation2013; Steiger & Abegg, Citation2015).
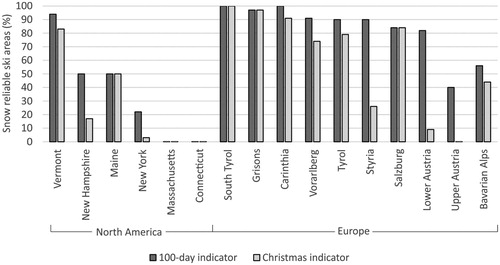
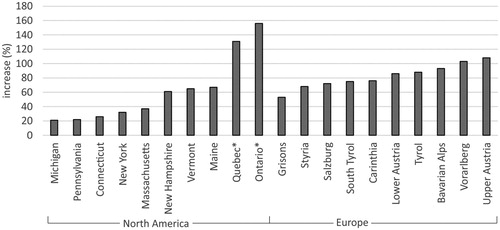
Figure 3. Required increase of produced snow to guarantee a 100-day season in a 2050s high emission scenario. Source: (Data from Scott et al., Citation2006, Citation2008; Steiger & Abegg, Citation2015). *Québec and Ontario based on case studies.