
Figures & data
Figure 1. The TPB with risk perception.
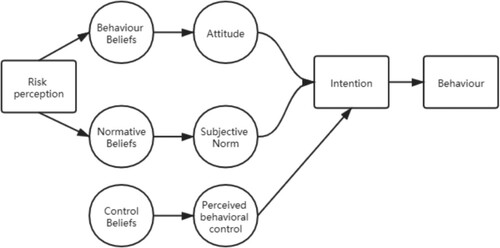
Figure 2. Tourist travel intention model based on TPB and risk perception.
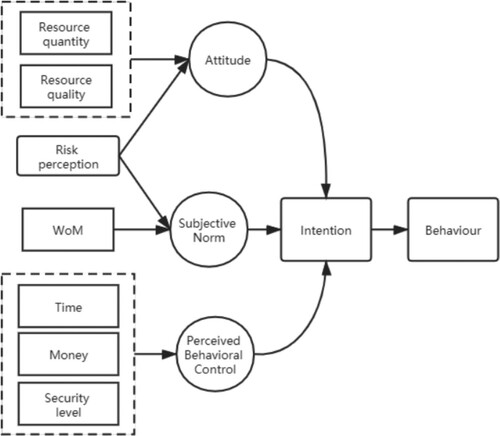
Figure 3. Map of Maldives (source: https://commons.wikimedia.org/wiki/File:Atolls_of_the_maldives.jpg).
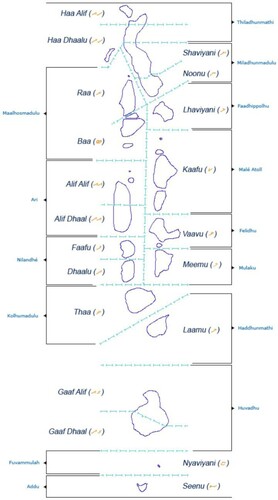
Table 1. Number of tourists changes between 2019 and 2020.
Table 2. Changes in gross domestic product from 2018Q3 to 2020Q3.
Figure 4. Tourist arrival and tourism economy subsystem. (The rectangle is the stock and the black arrowheads are flows. Flows will change the stock, which will generate behaviours in the system. The hexagons are policy variables. Others are variables and parameters that affect changes in stock and flow).
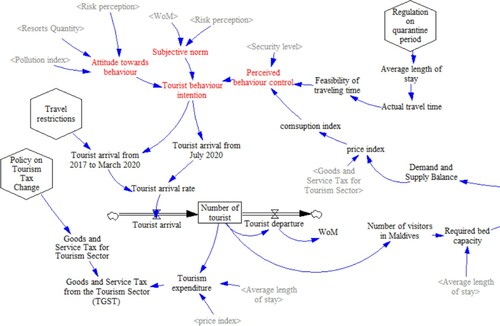
Figure 5. Tourism resort subsystem.
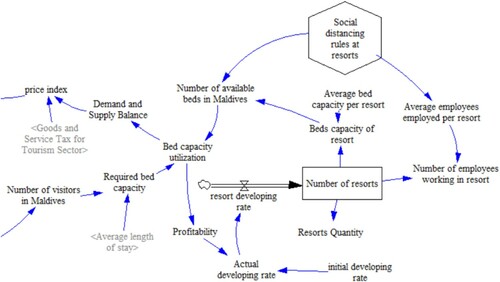
Figure 6. Residents and population subsystem.
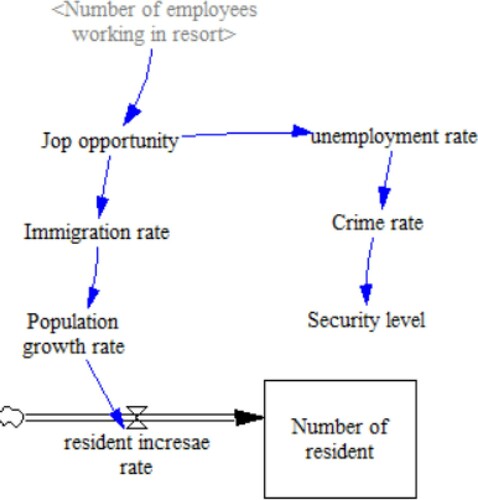
Figure 7. Waste and pollution subsystem.
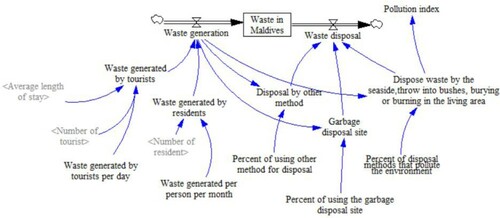
Figure 8. Health care subsystem.
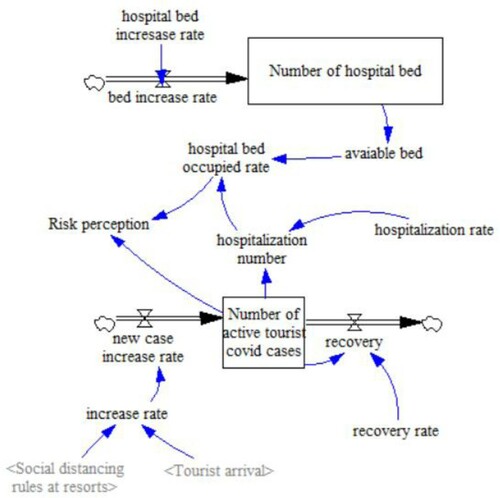
Table 3. Historical fit result (2017–2019).
Table 4. Parameter settings in different strategies.
Figure 9. Simulation results of the number of tourists from January 2017 to June 2020 (in thousands).
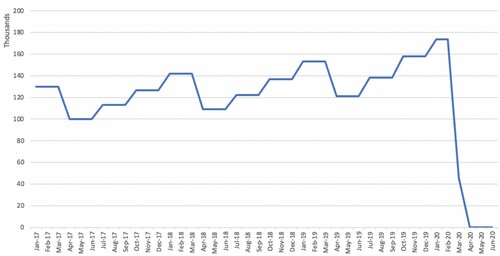
Figure 10. Simulation results of the number of tourists from July 2020.
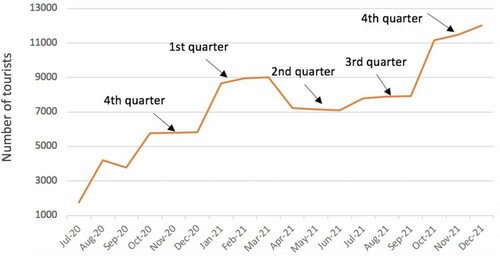
Figure 11. Prediction results of number of tourists under the social distancing strategy (in thousands).
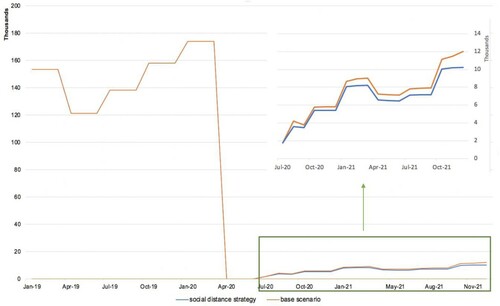
Figure 12. Prediction results of number of tourists under the tax reduction strategy (in thousands).
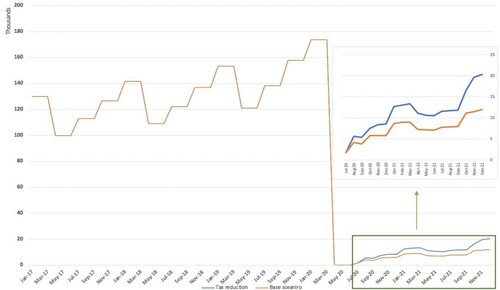
Figure 13. Prediction results of number of tourists under travel bubble strategy (in thousands).
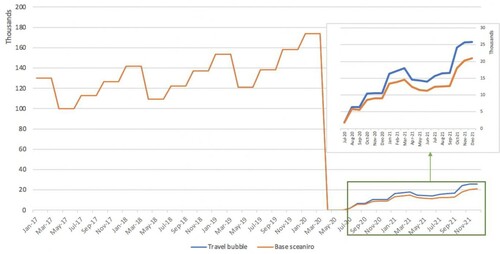
Figure 14. Prediction results of number of tourists under the joint strategy (in thousands).
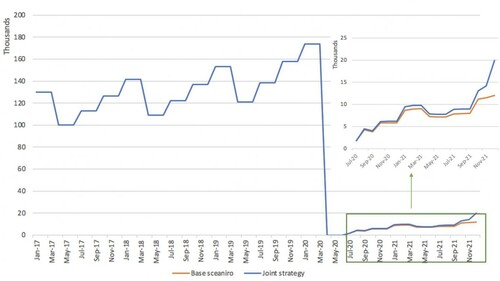
Figure 15. Prediction results of number of tourists under different scenario (in thousands).
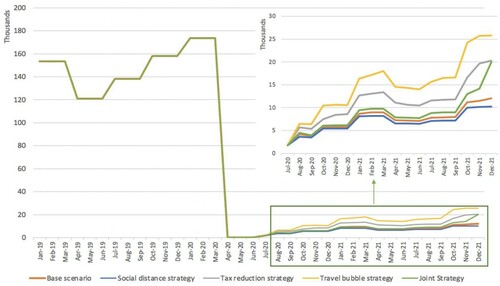
Figure 16. Prediction results of changes in tourists’ behaviour intention under four strategies. (The tourism behaviour intention is a value between 0 and 10, the higher the score, the greater the willingness to travel).
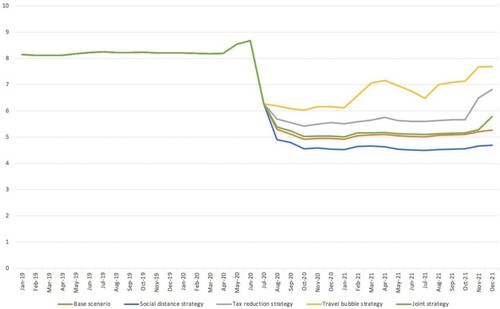
Table 5. Comparison of all recovery scenarios relative to the base case scenario.