Figures & data
Table 1. Sample characteristics by main financial indicators.
Figure 1. Financial-based and business-based clusters. Note: LCC = Low Cost Carriers; FSC = Full Service Carriers; IAG = International Airlines Group; C/A = Cash per Assets ratio.
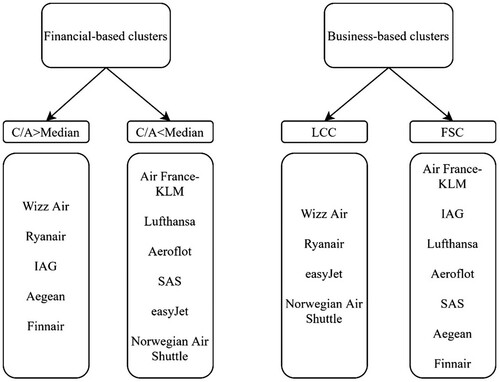
Figure 2. Time plane of analysis focusing on the main event day.
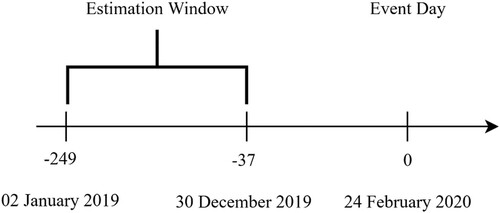
Figure 3. Time periods of the analysis focusing on the whole first wave and its periods.
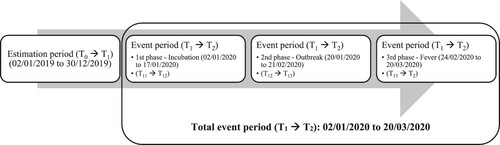
Table 2. AR t-test statistics around the key date (24 February) for the total sample.
Table 3. Cumulative average abnormal daily returns and standard deviations of total sample, and CAAR t-test statistics with critical values over the entire and three periods of the pandemic.
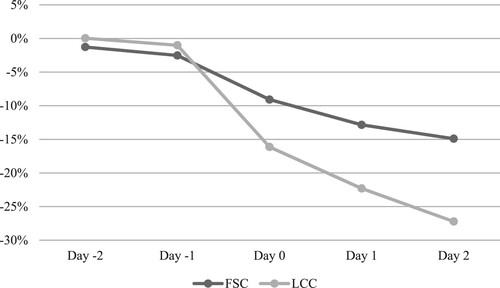
Figure 4. Evolution of total cumulative returns around the key-date (24 February) according to the financial-based clusters.
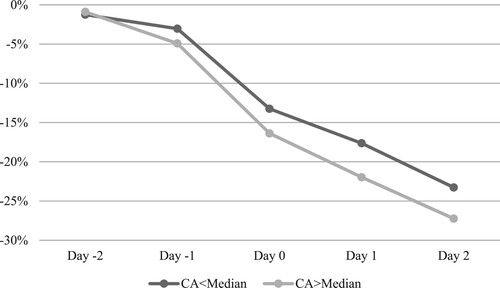
Table 4. Cumulated average abnormal returns of individual elements, averages of the sample with a cash/assets ratio above the median and standard deviations of these returns, and test statistics compared to the index of the average returns of airlines with a cash/assets ratio below the median, compared to time 0 on 24 February.
Table 5. Cumulated average abnormal returns of individual elements, averages of the sample of LCCs and standard deviations of these returns, and test statistics compared to the index of average returns of FSCs, compared to time 0 on 24 February.
Figure 5. Evolution of total cumulative returns around the key-date (24 February) according to the business-based clusters.