Figures & data
Figure 1. Analytical framework to interpret changes in tourism destinations based on data from LBSN.
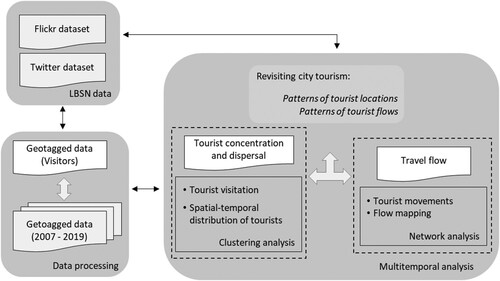
Figure 2. Monthly distribution (ln) along the time-series for tourists (left) and tourists' photos (right). Black dots correspond to the monthly values by year, and the red dots refer to the mean values.
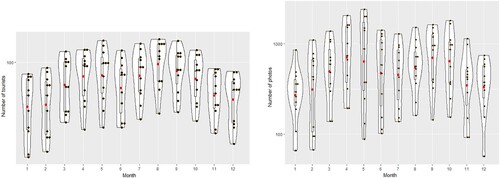
Table 1. Pearson correlation (r), coefficients of determination, F-test, and significance level between monthly visitor counts from Flickr and monthly hotel occupancy rates from 2012 to 2017.
Figure 3. Spatial distribution of city tourists in Lisbon based on Flickr data. The figure shows Flickr-based estimates of visitors in each specific area (grid cell) by year (2007, 2010, 2014, and 2017).
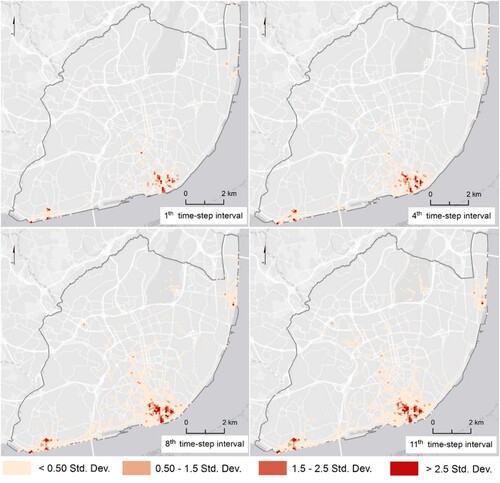
Figure 4. Group categories from spatiotemporal clustering.
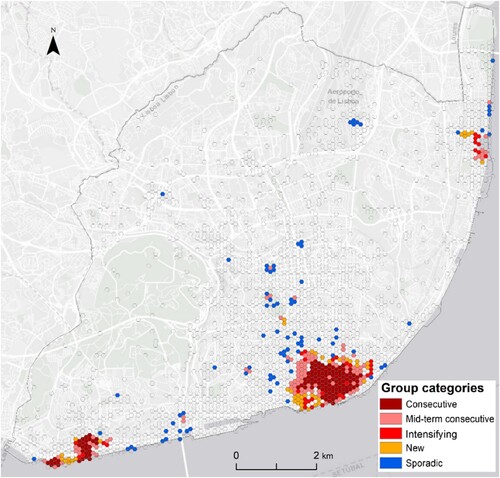
Table 2. Descriptive statistics of aggregated data with reference to the space–time cube.
Table 3. Descriptive statistics of the group categories from spatiotemporal clustering.
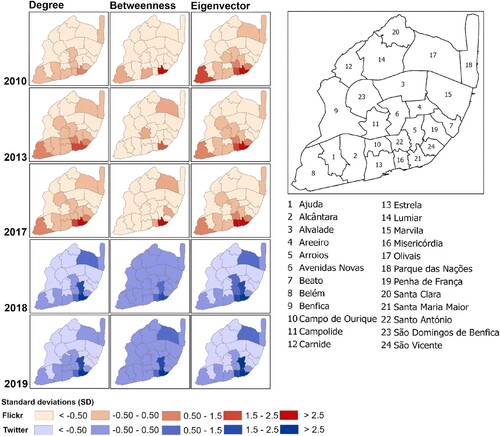
Figure 5. Tourist flows between parish areas in Lisbon, based on movement data derived from Flickr (2010, 2013, and 2017), and Twitter (2018, and 2019). The figure shows the resulting scores from centrality measures computed for each parish area.