Figures & data
Figure 1. Distribution of visual images according to categories from Visit Norway electronic promotion materials. Graph showing the number of analysed images within fourteen categories and their relation in percentage to the total number found on the Visit Norway website. Predominant images were found in the categories, such as nature, tourists, reindeer, architecture, and traditional costume. (Source: authors).
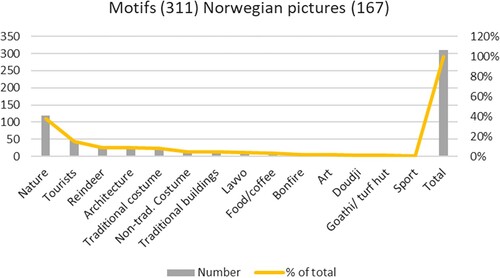
Figure 2. Distribution of visual images according to categories from Visit Sweden electronic promotion materials. Graph showing the number of analysed images within 14 categories and their relation in percentage to the total number found on the Visit Sweden website. Predominant were found in the categories, such as nature, tourists, reindeer, and traditional costume. (Source: authors).
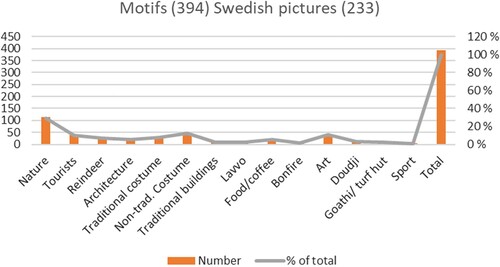
Figure 3. Distribution of images in the categories ‘people and location’ found in the electronic marketing from Visit Norway. Graph showing the share in per cent of total images found in the specific category ‘people and location’ found on the Visit Norway website. Images in this category are further subdivided in relation to the specific location. Images within categories such as sights, local scene and entertainment show no people present in relation to them. (Source: authors).
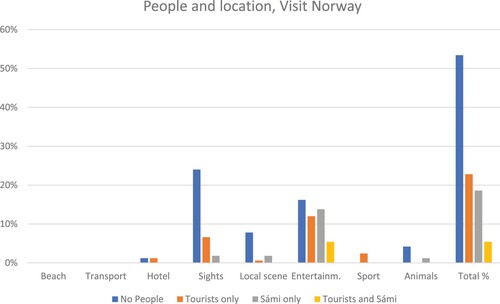
Figure 4. One of the examples of modern accessories using traditional inspiration from Stoorstålka, a Jokkmokk (Sweden) based company. A photograph showing two examples of modern woollen scarfs beside each other, inspired by traditional Sámi dresses and produced by the Stoorstaelka company which is based in the town of Jokkmokk in Sweden. (Source: author’s own).
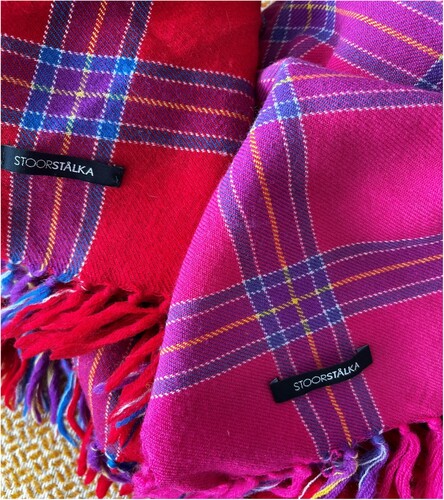
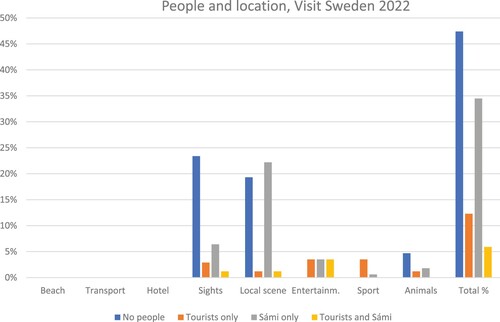
Figure 5. Distribution of images in the categories ‘people and location’ found in the electronic marketing from Visit Sweden. Graph showing the share in per cent of total images found in the specific category ‘people and location’ found on the Visit Sweden website. Images in this category are further subdivided in relation to the specific location. Images within categories such as sights and local scene show no people present in relation to them, but also higher occurrence of Sami in them. (Source: authors).