
Figures & data
Figure 1. Dynamic multiplier. Note: The solid black (dashed) line indicates the response of real GDP per worker for a unit increase (decrease) in visitor arrivals per worker.
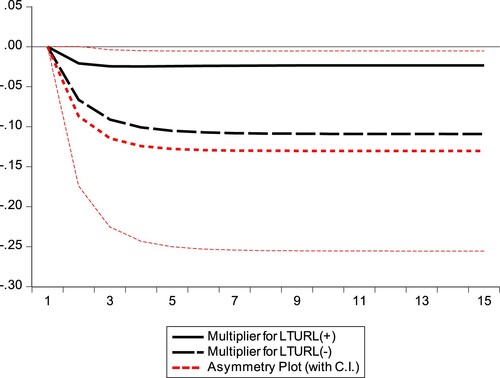
Table 1. Asymmetric effects test.
Table 2. Main results.
Data availability statement
We use a total of 42 years annual data from 1979–2020 for Fiji. The data for real GDP is available from 1960-2021. The data for investment is proxied by gross fixed capital formation (GFCF) and is available from 1980-2020. For Tonga, we use 25 years annual data from 1995-2019. Real GDP is available from 1981–2021 and GFCF is available from 1975-2021. For Vanuatu, real GDP is available from 1979–2021 and GFCF is available from 1983-2021. We use the perpetual inventory method to calculate the capital stock series. The initial capital stock is set to 1.5 times the initial real GDP value. The initial real GDP value is set to the year before the start of the investment series. The depreciation rate is set to 5 percent. Labour force participation rate data is available from 1990–2021 for all countries. The average of this multiplied with population derives the labour supply series. The data for visitor arrivals is available from 1975 to 2021 for Fiji, 1995–2019 for Tonga, and 1995–2020 for Vanuatu. Real GDP and GFCF data are in constant 2015 US dollars. All data is from the World Development Indicators database (2023). Visitor arrivals for Fiji is from the Fiji Bureau of Statistics (Citation2023).