
Figures & data
Figure 1. Research model.
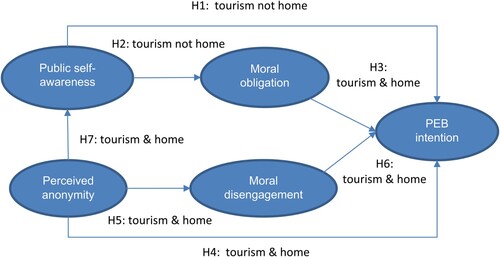
Figure 2. Results of paired-sample t-test (tourism versus home). Note: PEB = pro-environmental behaviour, T1 = onsite survey (tourism context), T2 = post-visit survey one month after T1 (home context).
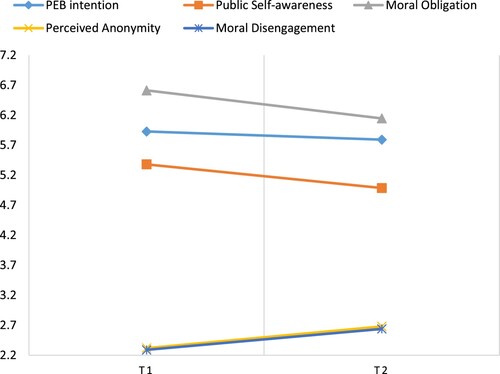
Table 1. Descriptive statistics and correlation among factors (N = 285).
Figure 3. SEM results for tourism context
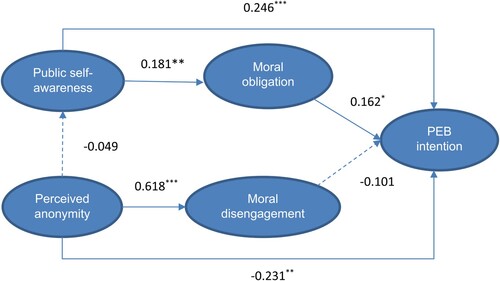
Figure 4. SEM results for one-month post-visit home context.
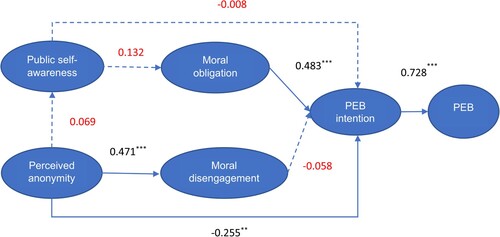
Table 2. Suppressor effect analysis.