
Figures & data
Table 1. Summary of studies combining exchange rates with relative prices.
Figure 1. Growth rates of inbound tourist arrivals and daily exchange rate returns. (a) Monthly growth rates of inbound tourist arrivals by country. (b) Daily exchange rate returns by country
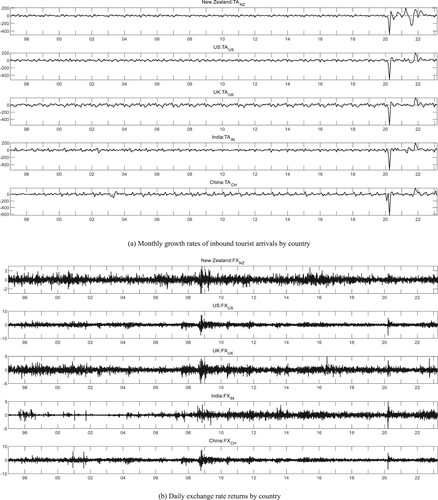
Table 2. Descriptive statistics.
Table 3. Estimation results of the ARDL-MIDAS model.
Figure 2. Length of the impacts of exchange rates on inbound tourist arrivals.
Notes: The horizontal axis is the number of days () for which the impact lasts and the vertical axis is the impacts of each lagged day on the current inbound tourist arrivals.
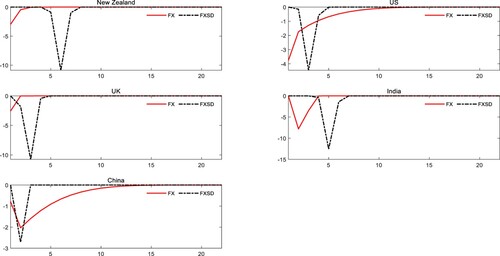
Table 4. Out-of-sample predictive performance.
Figure 3. Out-of-sample forecasting performance.
Notes: The figure measures the relative reduction in squared forecast errors for model against the benchmark which cumulates from 2020/1 to month
for country
. An increasing (decreasing)
means the candidate model
has smaller (larger) forecast errors and higher (lower) predictive power than the benchmark model.
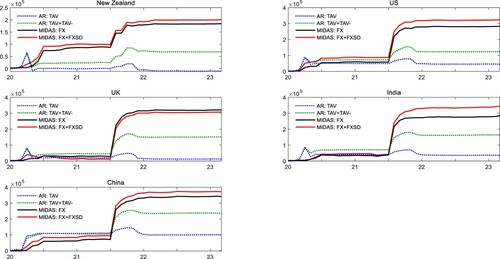
Table 5. Estimation results of the SARIMA-MIDAS model.