Figures & data
Table I. Main analytical characteristics, as defined by manufacturers of five non-isotopic and one isotopic testosterone immunoassays.
Table II. Testosterone concentration in serum samples from 100 men obtained by RIA and five non-isotopic methods.
Table III. Mean differences in T concentrations between RIA and tested immunoassays.
Table IV. Differences (%) in testosterone concentrations obtained by 5 non-isotopic methods and by RIA.
Figure 1. Percentage differences in testosterone concentrations measured by RIA and non-isotopic methods in two male subgroups, with RIA T < 10 nmol/L and RIA T > 10 nmol/L.
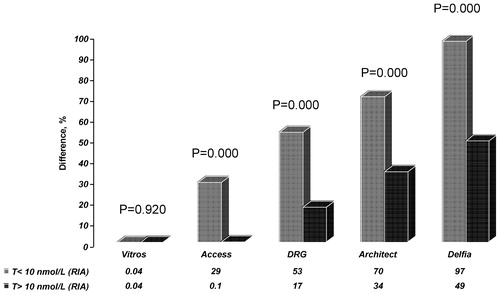
Figure 2. Correlation between total T concentrations (nmol/L) measured by both RIA and Vitros.
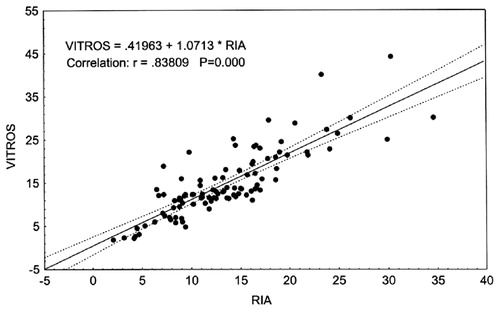
Figure 3. Correlation between total T concentrations (nmol/L)measured by RIA, Architect (upper plot) and DRG (lower plot).
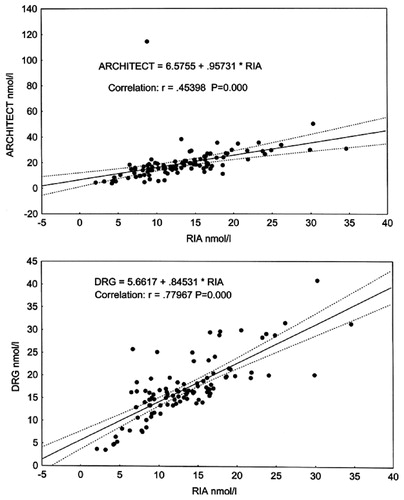
Figure 4. Correlation between total T concentrations (nmol/L)measured by RIA, Delfia (upper plot) and Access (lower plot).
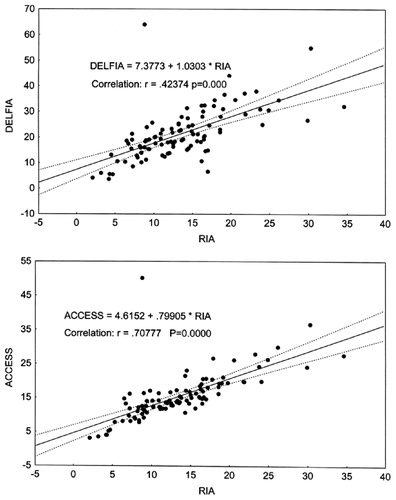
Table V. Comparison between testosterone results obtained using RIA and 5 non-isotopic immunoassays for samples in a subgroup with low testosterone concentrations (RIA T results < 10 nmol/l; n = 32) using regression analysis.
Table VI. Comparison between testosterone results obtained using RIA and 5 non-isotopic immunoassays for samples in a subgroup with high testosterone concentrations (RIA t results > 10 nmol/l; n = 68) using regression analysis.
Figure 5. Ratio of testosterone concentrations measured by Access, Vitros and RIA in two subgroups of men, with RIA measuring T < 10 nmol/L and T > 10 nmol/L.
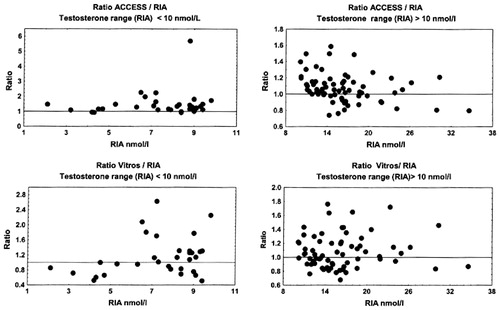
Figure 6. Ratio of testosterone concentrations measured by Architect, Delfia and RIA in two male subgroups, with RIA measuring T < 10 nmol/L and T > 10 nmol/L.
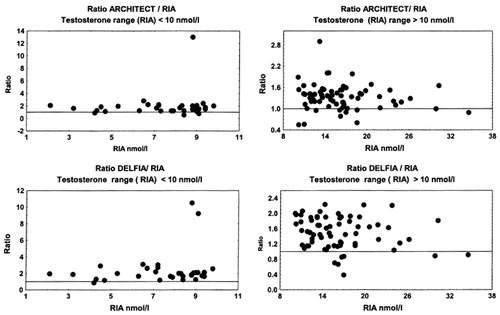
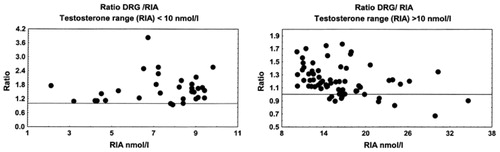
Figure 7. Ratio of testosterone concentrations measured by DRG and RIA in two male subgroups, with RIA measuring T < 10 nmol/L and T > 10 nmol/L.