
Figures & data
Table 1. Summary of clinical and socio-demographical characteristics of the participants.
Table 2. VAS, HAD and IIEF scores for controls and ED patients.
Table 3. Blood analysis and salivary testosterone levels.
Figure 1. Correlation analysis of salivary testosterone with total (A), free (B) and bioavailable testosterone (C). Each dot corresponds to a different participant. *Correlation is significant (p ≤ 0.05).
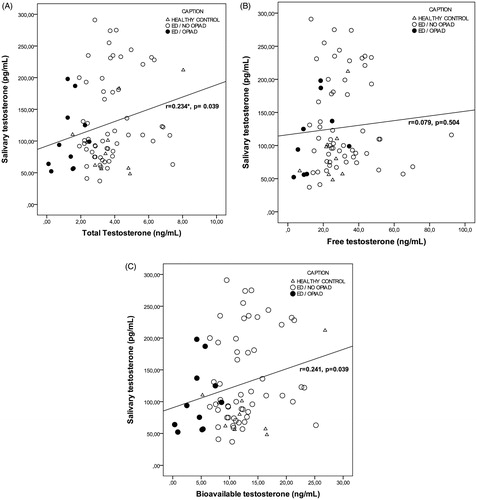
Table 4. Testosterone levels in ED patients according to ED severity.
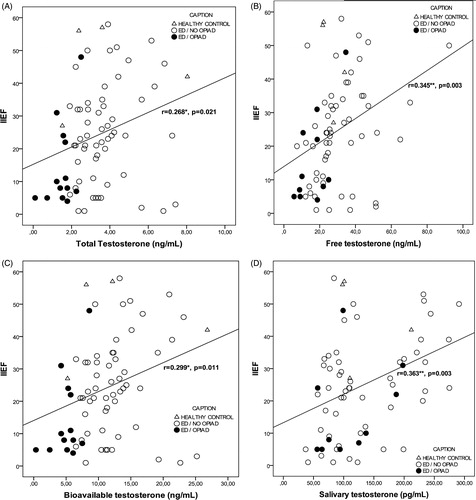
Figure 2. Correlation analysis of IIEF with total (A), free (B), bioavailable (C) and salivary (D) testosterone. Each dot corresponds to a different participant. *Correlation is significant (p ≤ 0.05). **Correlation is very significant (p ≤ 0.01).
Supplemental material