
Figures & data
Figure 1. The dynamics of urinary symptoms (UrS) and quality of life (QoL) in 124 men with BPH after thermobalancing therapy and in the control group by the International Prostate Symptom Score (IPSS).
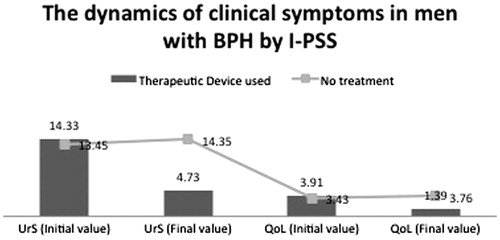
Figure 2. The changes in ultrasound prostate volume (PV) mL and uroflowmetry – Qmax mL/s parameters in 124 men with BPH after thermobalancing therapy & control group.
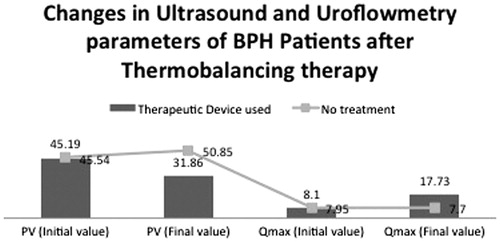
Table 1. Changes in prostate volume (PV, mL) and uroflowmetry (maximum urinary flow rate, Qmax, mL/s), and International Prostate Symptom Score (IPSS) for urinary symptoms (UrS) and quality of life (QoL), in men with BPH (PV >60 mL) upon thermobalancing therapy.
Supplemental material