Figures & data
Figure 1. Androgen biosynthesis pathway: Androgens are synthesized via a classical and non-classical pathway. Classical pathway is shown in light gray arrows while the backdoor pathway is the hatched arrows [Citation6].
![Figure 1. Androgen biosynthesis pathway: Androgens are synthesized via a classical and non-classical pathway. Classical pathway is shown in light gray arrows while the backdoor pathway is the hatched arrows [Citation6].](/cms/asset/427c47f9-510b-4084-bf5f-9f58da375fa3/itam_a_1272101_f0001_b.jpg)
Figure 2. Age profile of study participants. Controls were younger than BPH patients (p < 0.001).
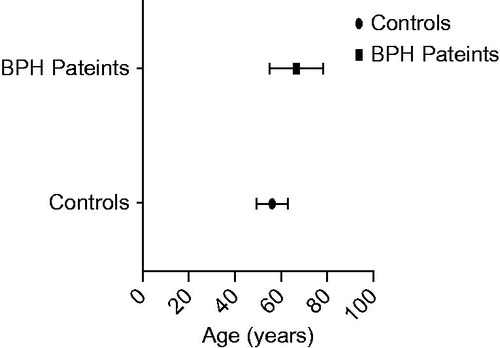
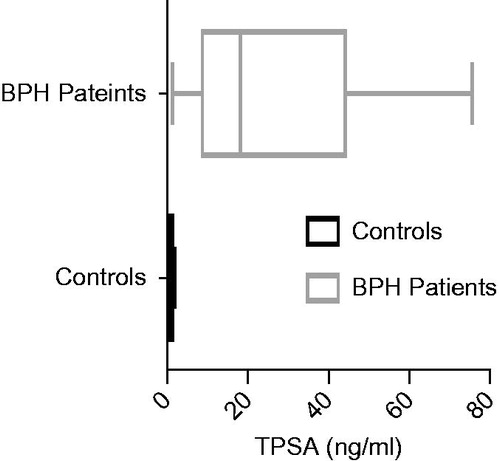
Figure 3. Total PSA levels of study groups. Total PSA (tPSA) was significantly lower in control group than in BPH patients (p < 0.001).