
Figures & data
Figure 1. Distribution, 95% confident interval of adjusted mean andropause symptoms scores between domains.
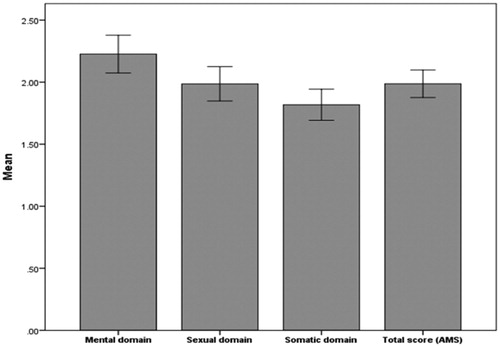
Table 1. Distribution frequency of andropause symptoms severity based on AMS questionnaire.
Table 2. Comparison mean ± SD of andropause symptoms score according to anthropometric and socioeconomic parameters.
Table 3. Distribution frequency of awareness questions about andropause.
Table 4. Compared mean between awareness score based on socioeconomic and personal variables.