Figures & data
Table 1. Data of articular cartilage thickness and chondrocytes numerical density and nuclear volume of the young control (YC), old control (OC), and old restricted groups (OCR).
Figure 1. Mean values of body mass (g) obtained monthly during the experimental period (12 months) for animals of OC group.
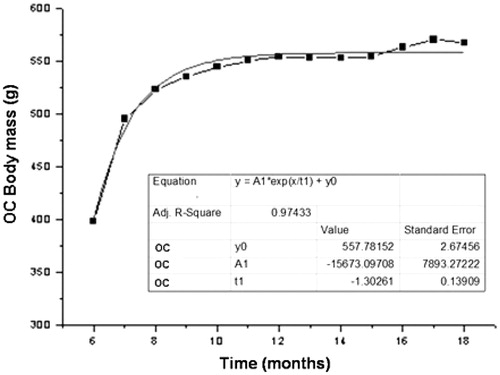
Figure 2. Mean values of body mass (g) obtained monthly during the experimental period (12 months) for animals of OCR group.
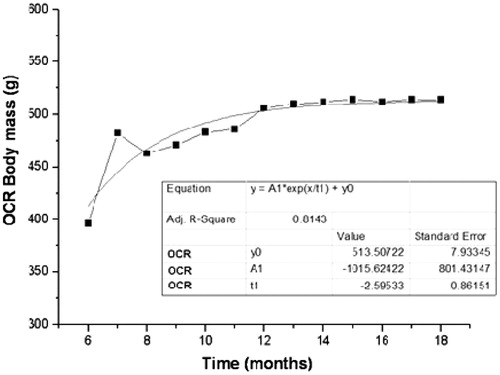
Figure 3. Volumetric proportion of collagen in the extracellular matrix (% by area) from the lateral and medial femoral condyle in the studied groups (YC, OC, OCR). *Significant in relation to the lateral condyle of YC group (p < .001); **Significant in relation to the lateral condyle of YC group (p < .05); #Significant in relation to the medial condyle of YC group (p < .001); ##Significant in relation to the medial condyle of OC group (p < .05).
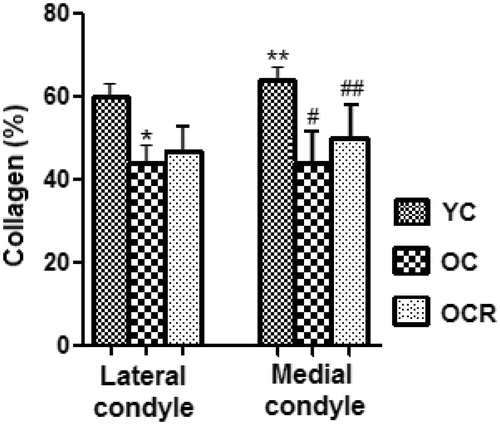
Figure 4. Histological sections of the articular cartilage of the femur showing the distribution of collagen fibers (arrows) in the layers of cartilage in the three studied groups (YC, OC, OCR); SB: subchondral bone. Picrosirius staining.
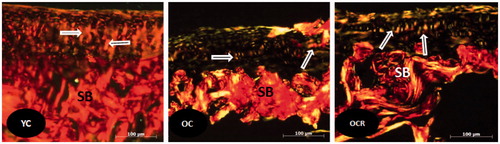
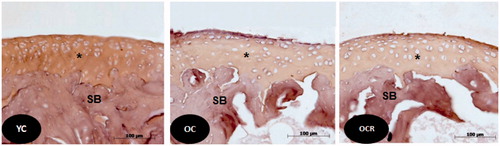
Figure 5. Histological sections of the articular cartilage of the femur showing the labeling of type II collagen in beige color (*) by Immunohistochemistry, in the three groups studied (YC, OC, OCR). SB: subchondral bone.