Figures & data
Figure 1. The graph depicts the decline with time in months from the median baseline line PSA to the median nadir PSA with the vertical axis being PSA in ng/ml and the horizontal axis being time in months.
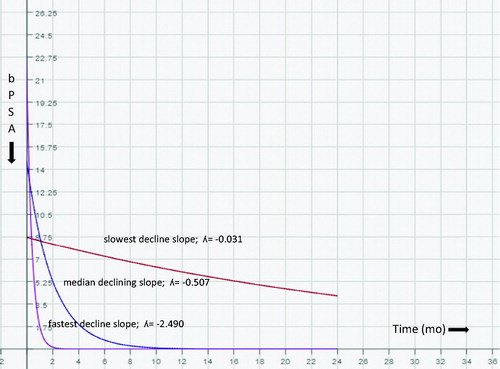
Table 1. The descriptive characteristics of patients and disease.
Table 2. The comparison of progressions of various parameters.
Table 3. The relationship between longer TTNP (>12 months) and parameters.
Table 4. The comparison of TTNP, post-nPSAT and total follow-up times between progression (+) and (−) groups.
Table 5. The relationship between PSA values and parameters.
Table 6. The evaluation of various parameters with univariate analysis in terms of progression predicting.
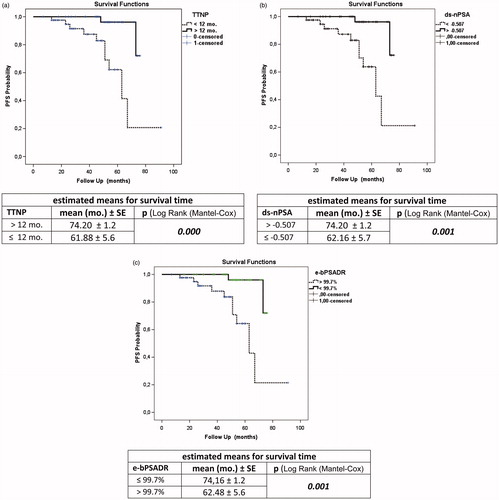
Figure 2. (a) KM plot and the estimated means for survival time for TTNP. (b) KM plot and the estimated means for survival time for ds-nPSA. (c) KM plot and the estimated means for survival time for e-bPSADR.