
Figures & data
Table 1. Baseline characteristics of elderly men with HF and healthy controls.
Figure 1. Relationship between serum TT with total fat mass (A) and adiponectin (B) in elderly men with HF.
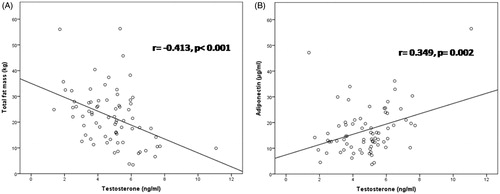
Figure 2. Relationship between serum TT with NT-proBNP in elderly men with HF.
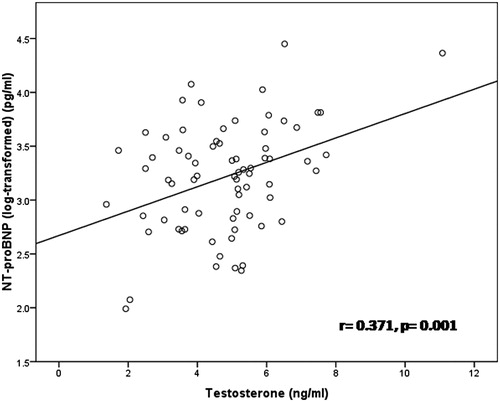
Table 2. Correlation of TT and eFT with other investigated variables in elderly men with HF.
Table 3. Multivariate regression analysis (stepwise model) with TT and eFT as dependent variables in elderly men with HF.
Figure 3. Kaplan–Meier survival analysis for TT deficiency in elderly men with HF.
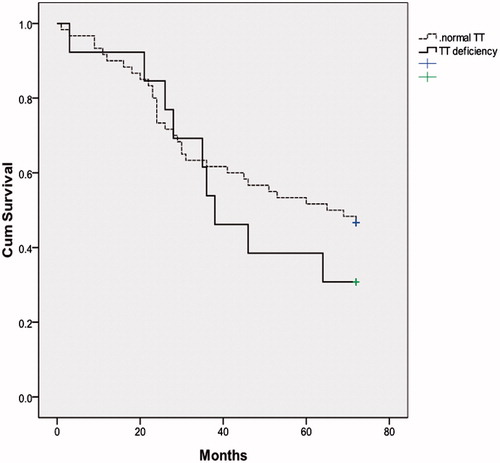
Table 4. Univariate and multivariate Cox regression analysis on predictors of all-cause mortality in elderly men with HF.