Figures & data
Table 1. Patient characteristics in nonstroke and stroke groups.
Table 2. Clinical postoperative outcomes in nonstroke and stroke groups.
Figure 1. Risk of urologic drug use in nonstroke and stroke groups during various follow-up periods.
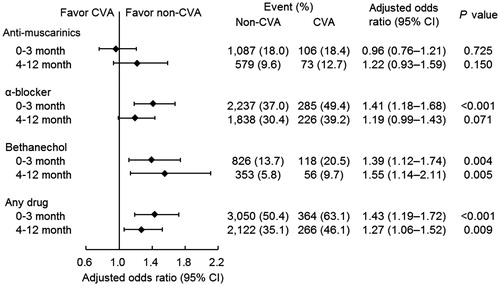
Figure 2. Adjusted medication-free survival curves in nonstroke and stroke groups (A) and hemorrhagic and ischemic stroke groups (B) during follow-up.
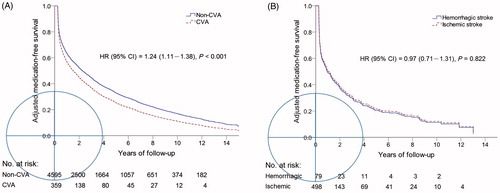
Figure 3. UTI and UR rates during 1 year before and after TURP in the nonstroke and stroke groups.
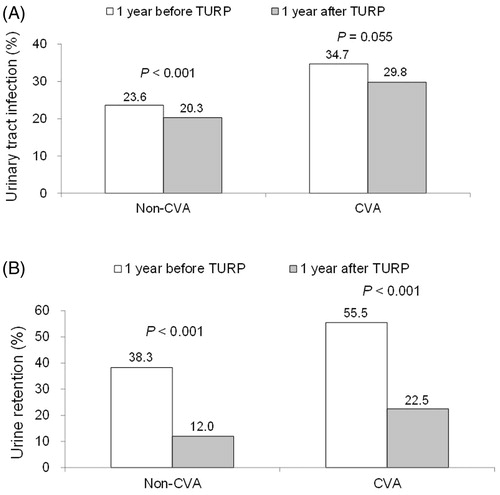
Figure 4. UTI and UR rates during 1 year before and after TURP in ischemic and hemorrhagic stroke groups.
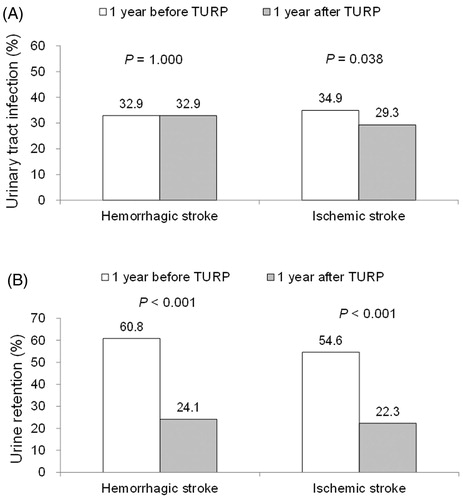
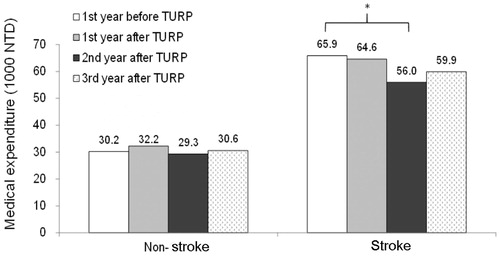
Figure 5. Medical expenses before and after TURP in the nonstroke and stroke groups.