
Figures & data
Table 1. Baseline characteristics between BPH participants and control patients.
Table 2. Descriptive statistics of IPSS, SF-12v2 scores and DASS-21 scores at baseline.
Table 3. Corrected item–scale correlation of the IPSS.
Figure 1. ROC curves of IPSS total symptom and HRQOL scores.
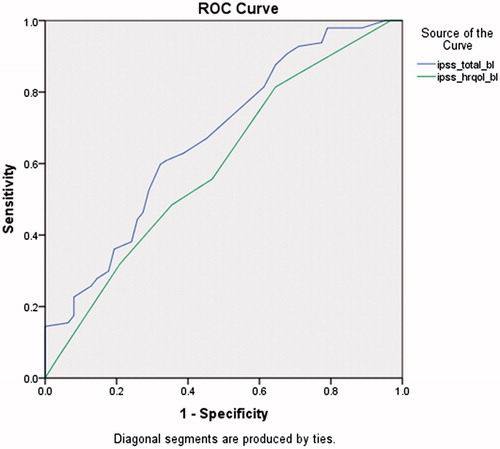
Figure 2. Ability of IPSS scores, SF-12v2 scores and DASS-21 scores in discriminating between benign prostatic hyperplasia and control patients by the independent t-test. Error bars indicate mean +/- standard deviation.
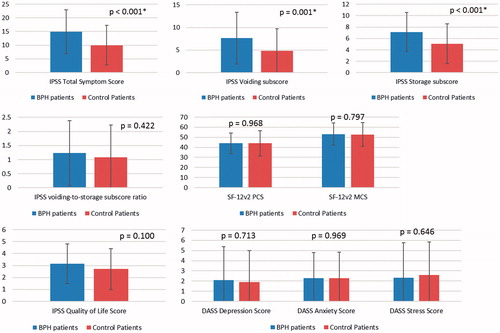
Table 4. Responsiveness to change over time from baseline to 6-month follow-up (N = 91).
Table 5. Responsiveness to change over time from baseline to 6-month follow-up among patients with improved health status (N = 27).