
Figures & data
Table 1. Characteristics of the patients from the series.
Table 2. Comparative analysis of measurements obtained by MRI.
Table 3. Univariate and multivariate logistic regression analyses.
Figure 1. Calibration plot.
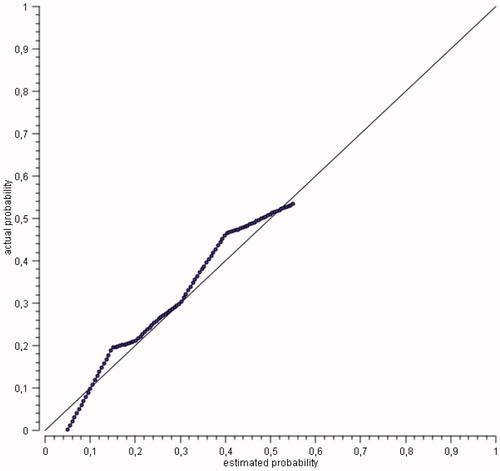
Figure 2. ROC-curve.
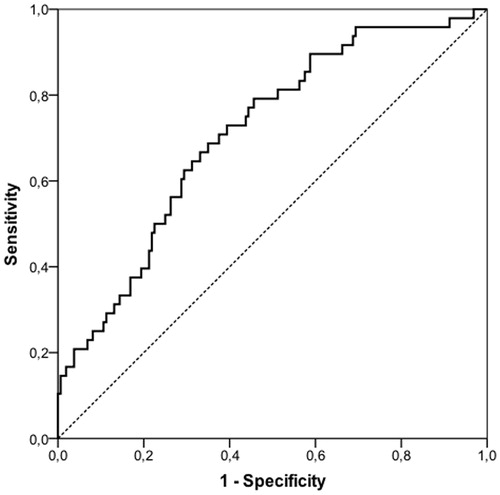
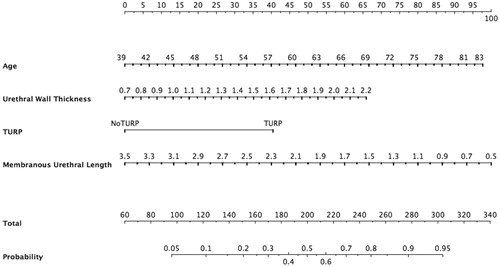
Figure 3. CUN-nomogram. Variables have a value that should be searched in each horizontal line. For each value, a score out of 100 is given in the upper horizontal line. We have to combine the scores and search the result in total score line, after drawing a perpendicular line we obtain probability.
Supplemental material