Figures & data
Table 1. Primers used for real-time PCR.
Table 2. Mean and S.D or Median (range) of age, prostate size and biochemical parameters among BPH groups.
Figure 1. (A) Relative fold change of IR A and IR B in prostate tissues of BPH patients (Group A: Prostate size <30 Ml, Group B: Prostate size >30 ml). Data were expressed in Mean ± SEM. *p = .007 for IR A, p = .01 for IR B. (B) Relative fold change of IRS-1 and IRS-2 in prostate tissues of BPH patients (Group A: Prostate size <30 Ml, Group B: Prostate size >30 ml). Data were expressed in Mean ± SEM. p value – .12 for IRS-1, p value – .25 for IRS-2.
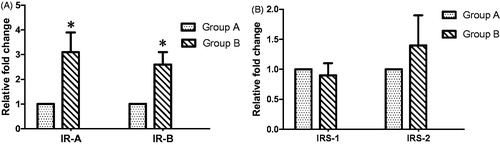
Figure 2. Relative fold change of IGF-1, IGF-2, IGF-1 R and IGFBP-3 in prostate tissues of BPH patients (Group A: Prostate size <30 Ml, Group B: Prostate size >30 ml). Data were expressed in Mean ± SEM. *p = .001 for IGF-1, p = .003 for IGF-2, p = .003 for IGFBP-3.
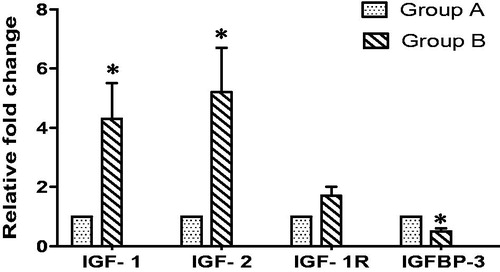
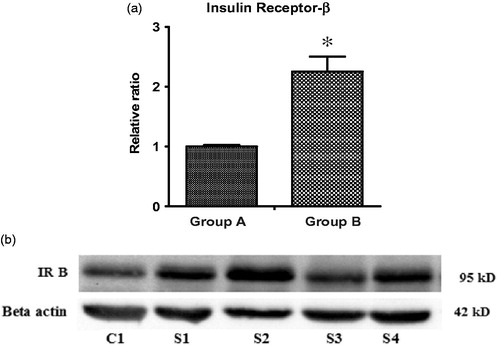
Figure 3. (a) Relative ratio of IR-B/Beta actin protein expression in prostate tissues of BPH patients. Data were expressed in Mean ± SEM, *indicates statistically significant, p values – .05 for IR-B. (b) First line (C1) represent Group A (<30 ml prostate size), next four lines (S1, S2, S3, S4) represents Group B (>30 ml prostate size).