Figures & data
Table 1. Clinical and laboratory features of patients with erectile dysfunction.
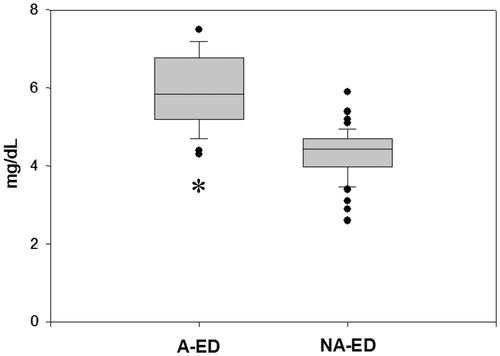
Figure 1. Uric acid concentrations in men with ED-AR and NA-ED. A-ED: arteriogenic erectile dysfunction; NA-ED: non-arteriogenic erectile dysfunction. *p < .001 vs. NA-ED. The upper and the lower limits of the boxes and the horizontal line within the boxes indicate the 75th and 25th percentiles and the median, respectively. The whisker caps indicate the 90th and 10th percentiles. Asterisk indicates statistical significance.