Figures & data
Figure 1. Penile anatomy.
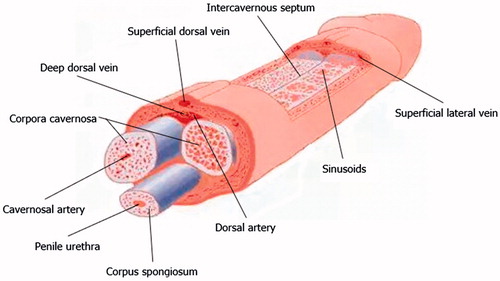
Figure 2. Endothelial and nitrergic dysfunction in microcirculation.
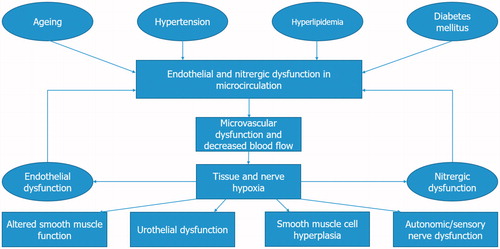
Table 1. Etiology of erectile dysfunction.
Figure 3. Normal and pathological hypothalamic–pituitary–testicular axis. (A) Normally functioning hypothalamic–pituitary–testicular axis. Gonadotropin-releasing hormone (GnRH) stimulates the release of luteinizing hormone (LH). This triggers the testes to respond by secreting testosterone, which, in turn, exerts a negative feedback on the hypothalamus and pituitary gland. Both circulating LH and testosterone are within the normal range. (B) Central hypogonadism. The pituitary release of LH is impaired, the testes are no longer stimulated and testosterone production drops; both circulating LH and testosterone are decreased. (C) Subclinical or compensated hypogonadism. The testicular responsiveness to LH is impaired, testosterone production is maintained owing to overstimulation by LH; circulating testosterone is normal or borderline, whereas LH is increased. In this case, the system is driven to its maximal capacity and no further adjustment can be achieved. (D) Primary hypogonadism. In testicular failure, increases in LH serum levels can no longer sustain testosterone release by Leydig cells; circulating testosterone is low and LH is high.
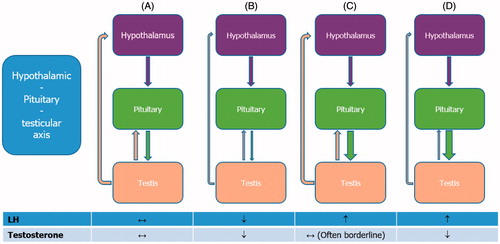
Table 2. Differences in symptoms of erectile dysfunction by etiology.
Table 3. Princeton III consensus recommendations for risk stratification and cardiovascular evaluation for sexual activity.
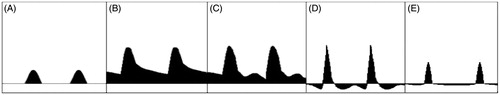
Figure 4. Schematic representation of the main phases of cavernosal artery waveform during a penile Doppler ultrasound examination. (A) In basic conditions, the waveform appears hardly detectable in a velocity/time curve. (B) A few minutes after injection of alprostadil, the cavernosal artery inflow becomes well detectable. (C) The waveform continues to modify with increasing peak systolic velocity (PSV, cutoff >35 cm/s) and decreasing end-diastolic velocity (EDV, cutoff <5 cm/s), until the systolic velocity peaks, indicating the grade of arterial inflow. Acceleration time (AT, cutoff <100) narrows, and can be measured from the bottom to the top of the peak. (D) Later, diastolic flow reversal is shown, indicating an intact venous occlusion mechanism. (E) Intracavernosal pressure exceeds systolic pressure at maximal tumescence, causing reduction in the systolic velocity and narrowing of the systolic peak.