Figures & data
Figure 1. Representative manometric test. 1, rectal pressure; 2, resting pressure (in the anal canal); 3, maximum pressure (three voluntary contractions). The X axis shows time in minutes, while the Y axis shows pressure in mmHg.
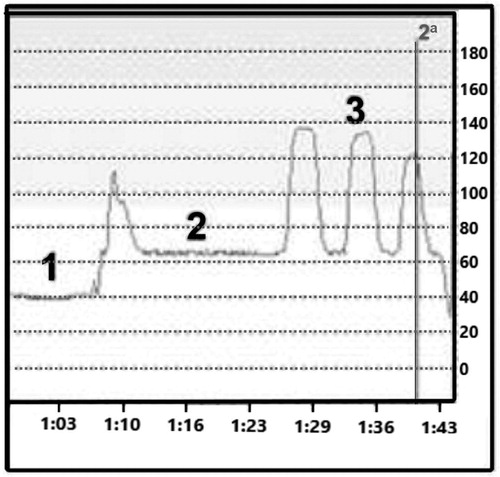
Figure 2. Correlation between physical activity level in multiples of resting metabolic rate (MET) and anorectal manometry values (mmHg). Resting pressure, maximum pressure, and rectal pressure was assessment. Spearman test correlation. *p < .05.
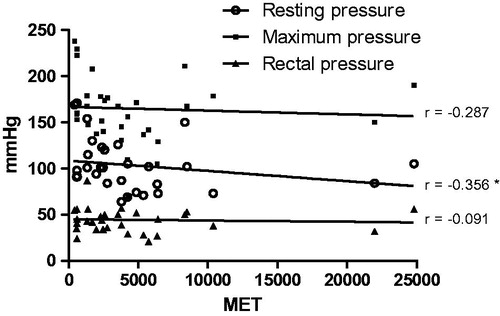
Figure 3. Correlation between multiples of the resting metabolic rate (MET) corresponding to walking and the anorectal manometry values (mmHg). Resting pressure, maximum pressure, and rectal pressure were assessed. Spearman test correlation. *p < .05.
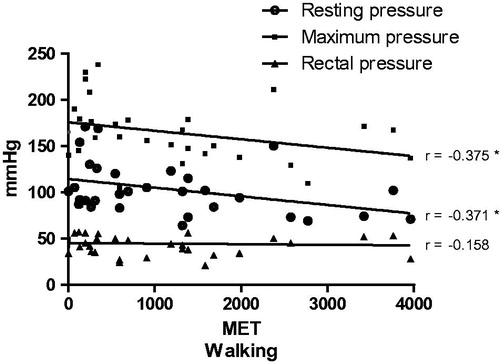
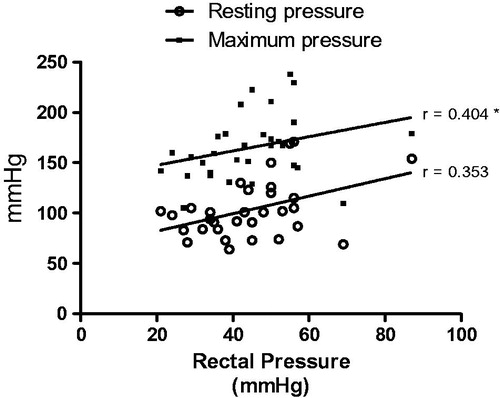
Figure 4. Correlation between rectal pressure (mmHg) and maximum and resting pressure (mmHg). Spearman test correlation. *p < .05.